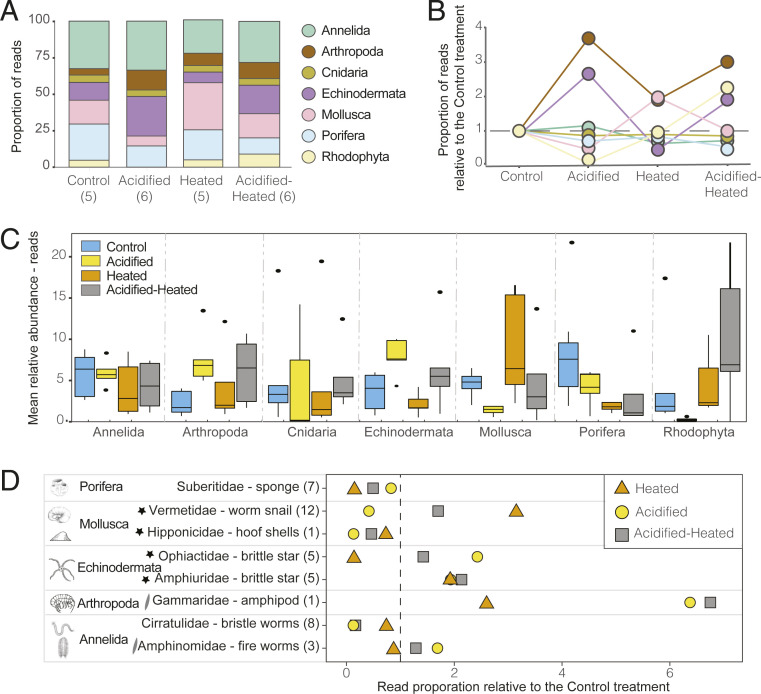
Fig. 3.
Variation in the top seven most abundant phyla and the top eight most abundant families among treatments. (A) Proportion of reads by phyla within treatments with the number of sampling units in parentheses. (B) Proportion of reads by phyla among treatments relative to the present-day (Control) condition. (C) Relative abundance of phyla among treatments. Box plots show the median as the center line, box limits are upper and lower quantiles, whiskers are 1.5× interquartile range, and open circles represent outliers. (D) The eight identified families that each represent >4% of total reads, showing the proportion of reads compared to present-day (Control—represented by the vertical line at x = 1). Parentheses next to families represents the number of MOTUs within that family, the stars represent heavily calcifying families, and the slanted lines symbol represents families with limited calcification. The number of reads and MOTUs from these eight families represent 53% and 15% of the total, respectively.

