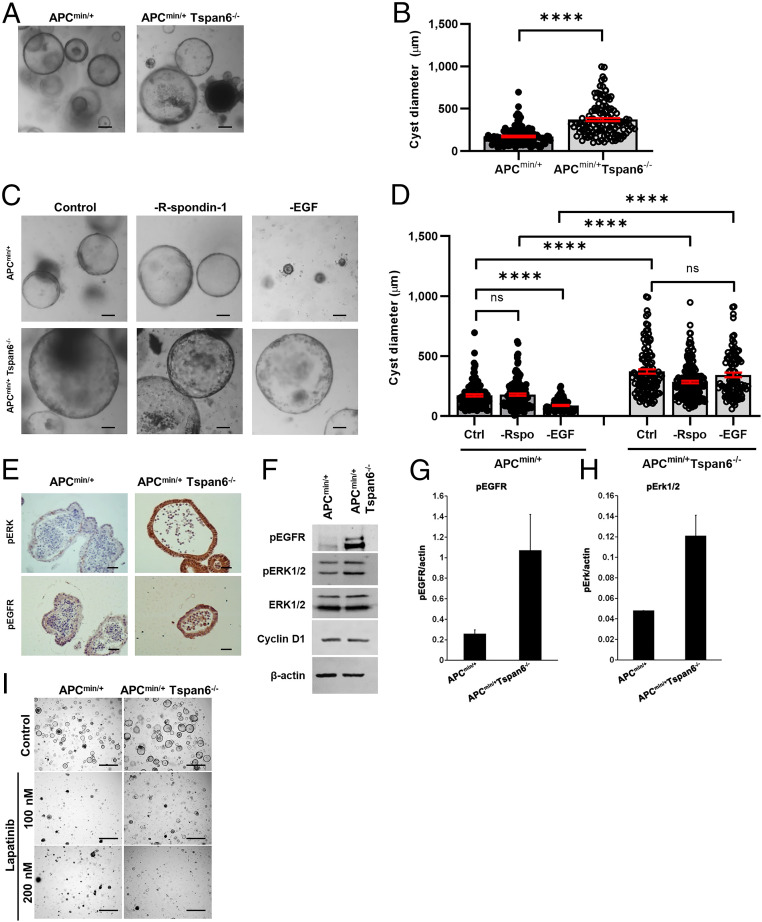
Fig. 2.
Tspan6 loss results in EGF-independent growth of intestinal organoids derived from APCmin/+ and APCmin/+Tspan6−/− mice. (A) Representative pictures of the APCmin/+ and APCmin/+Tspan6−/− intestinal organoids (n = 3). Mouse intestinal organoids were derived from APCmin/+ and APCmin/+Tspan6−/− mice and cultured in mouse intestinal organoid media for 5 d. (Scale bars: 100 μm.) (B) Quantification of size distribution of intestinal organoids from APCmin/+ (n = 116) and APCmin/+ Tspan6−/−(n = 119) mice. The measurement of diameter of each organoid was carried out using ImageJ; at least 10 fields of view were analyzed (n = 3). Data presented as mean ± SEM, ****P < 0.0001; ns, not significant (Mann–Whitney U nonparametric test). (C) Representative pictures of the APCmin/+ and APCmin/+Tspan6−/− intestinal organoids cultured in complete organoid growth media containing EGF, Noggin, and R-spondin-1 (control) and in media lacking R-spondin-1 (−R-spondin-1) or EGF (−EGF) (n = 3). (Scale bars: 100 μm.) (D) Quantification of size distribution of intestinal organoids from APCmin/+ and APCmin/+Tspan6−/− mice cultured in complete growth media (Ctrl) (n = 116 and n = 119, respectively) in media lacking R-spondin-1 (−Rspo) (n = 144 and n = 195, respectively) or EGF (−EGF) (n = 95 and n = 94, respectively). The measurement of diameter of each organoid was performed using ImageJ; at least 10 fields of view were analyzed (n = 2). Data presented as mean ± SEM, ****P < 0.0001; ns, not significant (one-way ANOVA test). (E) Representative images of pEGFR and pERK IHC staining of FFP-embedded APCmin/+ and APCmin/+Tspan6−/− mouse intestinal organoids (n = 5). (Scale bars: 25 μm.) (F) Western blot showing the increase in pEGFR and pERK expression in APCmin/+ and APCmin/+Tspan6−/− mouse intestinal organoids. (G) Quantification of EGFR activation relative to β-actin expression in APCmin/+ and APCmin/+Tspan6−/− mouse intestinal organoids. Data presented as mean of two independent experiments ± SEM. (H) Quantification of Erk1/2 activation relative to β-actin expression in APCmin/+ and APCmin/+Tspan6−/− mouse intestinal organoids. Data presented as mean of two independent experiments ± SEM. (I) Representative images of APCmin/+ and APCmin/+Tspan6−/− organoids in response to pan-EGFR inhibitor lapatinib after 5 d of culture. (Scale bars: 500 μm.)

