Fig. 6.
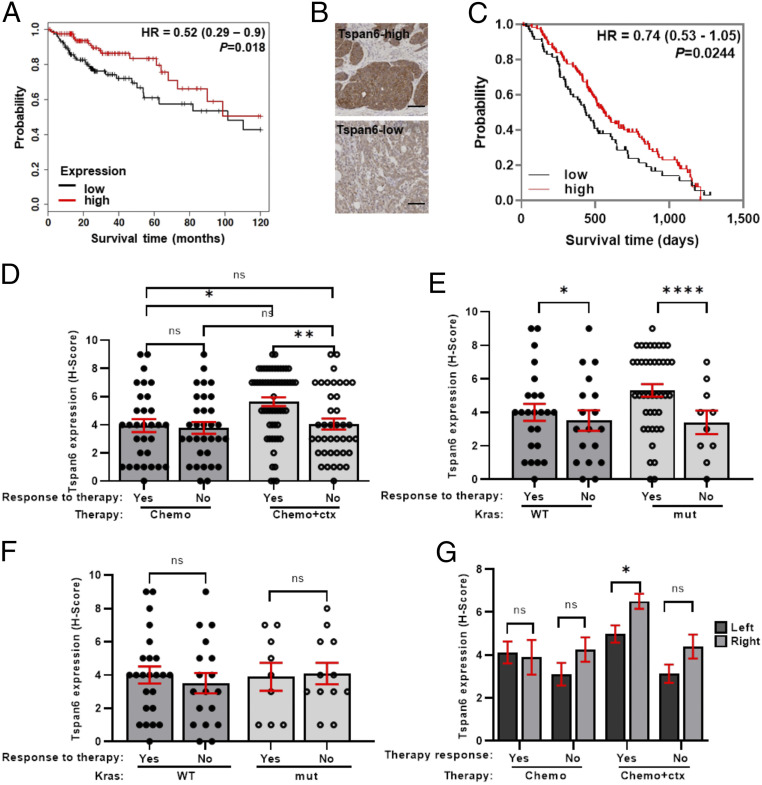
The decreased expression of Tspan6 correlates with poor survival prognosis in patients with colorectal adenocarcinomas. (A) Kaplan–Meier survival curves for 10-y overall survival of CRC patients with Tspan6-high and Tspan6-low expression of CRC patients with adenocarcinomas (n = 252). P values were determined by log-rank test and are shown for comparisons of Tspan6-high expression (n = 125) and Tspan6-low expression (n = 127) in adenocarcinomas. (B) Representative images of Tspan6-high and Tspan6-low protein expression in CRC tumors from patients of COIN clinical trial cohort. (C) Kaplan–Meier survival curves for overall survival of CRC patients with Tspan6-high and Tspan6-low expression of the COIN cohort (n = 182). P value was determined by Gehan–Breslow–Wilcoxon test and are shown for comparisons of Tspan6-high (n = 112) and Tspan6-low (n = 70) expression in the whole cohort. (D–G) The correlation of Tspan6 expression with responses of CRC patients treated with chemotherapy alone or chemotherapy in combination with Cetuximab (COIN study). (D) Responses in the whole cohort of patients treated with chemotherapy (response n = 31, no response n = 31) and patients treated with chemotherapy combined with cetuximab (response n = 40, no response n = 58). Data presented as mean ± SEM, **P = 0.0043, *P = 0.0106, ns: not significant (two-way ANOVA test). (E) Responses of the patients with mutated K-Ras (n = 46) or WT K-Ras (n = 52) to the chemo + Cetuximab therapy. Data presented as mean ± SEM, ****P < 0.0001, *P = 0.0415, ns: not significant (two-way ANOVA test). (F) Responses of the patients with mutated K-Ras (n = 21) or WT K-Ras (n = 42) to the chemotherapy only. Data presented as mean ± SEM, ns: not significant (two-way ANOVA test). (G) The expression of Tspan6 in tumors that have responded to the therapy (chemotherapy only or chemotherapy combined with cetuximab) in left-sided (n = 111) or right-sided (n = 72) colorectal adenocarcinomas. Data presented as mean ± SEM, *P = 0.0125 (two-way ANOVA test).

