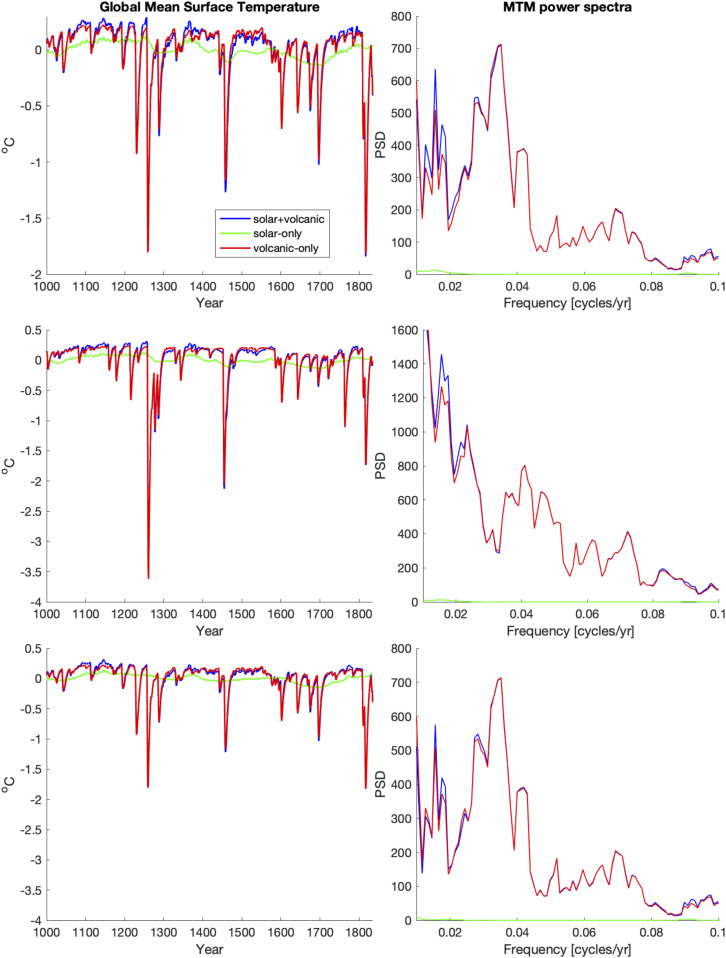
Fig. 2.
Energy Balance Model (EBM) simulations and associated power spectral density (PSD) estimates (from ref. 51). Shown are (Left) global mean surface temperature anomaly series from 1000 to 1835 CE and (Right) corresponding MTM (Multitaper Method) power spectra using both solar and volcanic forcing (blue), solar only (green), and volcanic only (red). Forcings used correspond to CEA volcanic series and SBF solar series (Top), GRA (Gao et al.) volcanic series and SBF (Steinhilber et al.) solar series (Middle), and CEA (Crowley and Untermann) volcanic series and VSK (Vieira et al.) solar series (Bottom). [See ref. 51 for full details.]

