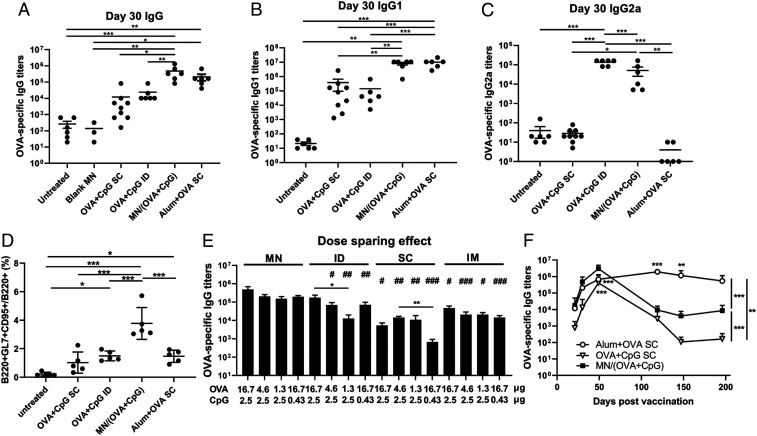
Fig. 4.
MN vaccine induces potent humoral immune responses. Mice were either untreated (n = 6) or immunized with blank MN (n = 3), OVA (16.7 µg) + CpG (2.5 µg) –coated MN patches (n = 6), OVA (16.7 µg) + CpG (2.5 µg) subcutaneously injected (n = 9) or intradermally injected (n = 6), or SC injection of 500 µg Alum + 16.7 µg OVA (n = 6). All groups received two immunizations of the same doses of antigen and adjuvant on day 0 and 23. Serum samples were collected on day 21, 30, 49, 119, 147, and 196 and analyzed by ELISA. (A) Total IgG on day 30. (B) IgG1 on Day 30. (C) IgG2a on day 30. (D) Percentage of B cells in GCs in the dLNs on day 46 post–prime immunization by flow cytometry analysis. For the dose-sparing study, mice were immunized (n = 5 per group) on days 0 and 21 with MN patches loaded with various amounts of OVA and CpG or the equivalent of soluble OVA and CpG injected by ID, SC, or intramuscular (IM) routes. OVA-specific IgG titers were evaluated on day 28 (E). (F) Kinetics of IgG. All data are presented as mean ± SD of samples of individual animals. For A–E, data were analyzed by one-way ANOVA. In E, the data were analyzed by one-way ANOVA within each administration route (shown as *) or across the groups among the various routes with equivalent dosages (shown as #, all against MN). In F, data were compared by two-way ANOVA. * and #, P < 0.05; ** and ##, P < 0.01; *** and ###, P < 0.001.

