Fig. 1.
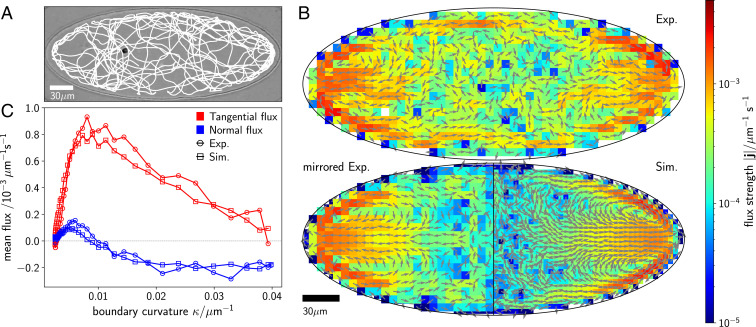
Cell trajectory and emerging nonequilibrium fluxes inside an elliptical compartment. (A) Optical micrograph of a single C. reinhardtii cell contained in a quasi-2D elliptical compartment with a major semiaxis of m and a minor semiaxis of m. A representative section of the fully tracked cell trajectory is overlaid in white. The cell is visible at the left of the center. (B) Steady-state nonequilibrium fluxes with arrows indicating their direction and their strength encoded with color. The fluxes obtained by direct analysis of the experimental (exp.) trajectories are shown in B, Upper. Considering the system’s symmetry, we can increase the available statistics by mirroring along the major and minor axes of the ellipse and, thus, reducing the noise in the fluxes (B, Lower, left). The fluxes resulting from Brownian dynamics simulations (see Numerical Model and Simulation Parameters and SI Appendix for details on our model) are shown in B, Lower, right. (C) Steady-state fluxes in a strip within m from the wall in tangential (red) and normal (blue) directions comparing experiments (circles) and simulations (rectangles). Positive tangential fluxes denote fluxes toward lower curvature; positive normal fluxes denote the direction away from the wall.

