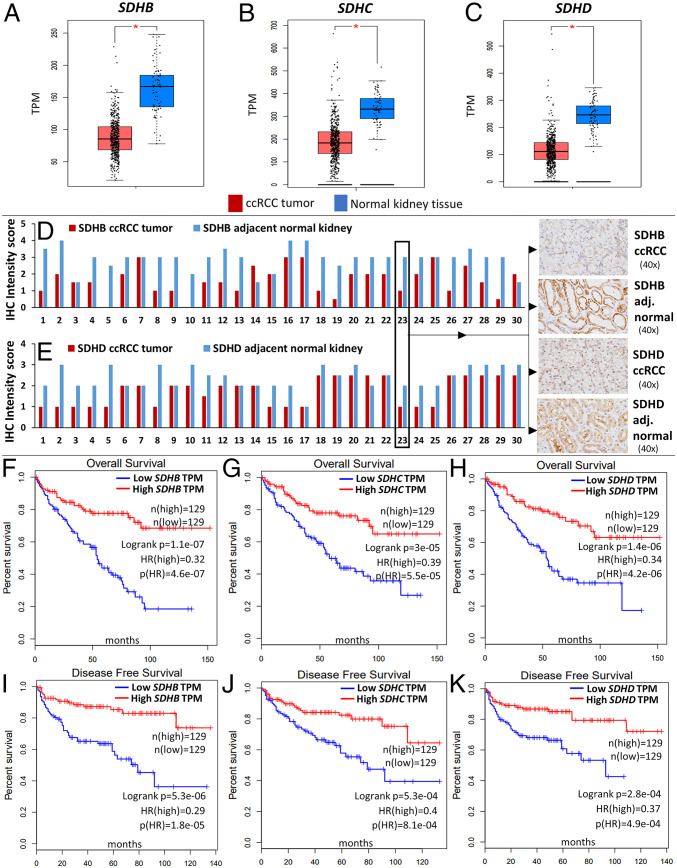
Fig. 1.
SDH subunits (B, C, D) are significantly underexpressed in ccRCC and associated with markedly worse survival. (A–C) Analysis of the TCGA-KIRC dataset revealed that SDH subunits SDHB, SDHC, and SDHD are significantly down-regulated in ccRCC tumor (n = 573) compared to normal renal tissue (n = 72) (P < 0.05 for each subunit). Paired ccRCC tumor–normal comparisons are shown in SI Appendix, Fig. S1. (D, E) SDHB and SDHD Immunohistochemistry in primary ccRCC versus adjacent normal kidney tissue revealed down-regulation of both subunits in ccRCC at the protein level. Stain intensity was on a scale of 0 (negative) to 4+ (strongly positive). For both antibodies, the nonneoplastic tubular cells in the resection stained consistently stronger than the clear cell carcinoma cells (n = 30, paired t test P values of 1.4E-08 and 4.2E-06 for SDHB and SDHD, respectively). Representative IHC images are shown (case 23). Only two out of the 30 cases did not have a decrease in either SDHB or SDHD intensity score in ccRCC compared to adjacent normal kidney. (F–K) Survival analyses of the TCGA-KIRC dataset revealed a markedly worse overall survival (OS) (F–H) and disease-free survival (DFS) (I–K) with lower expression of SDHB, SDHC, and SDHD. The OS hazard ratio (HR) for high (n = 129) versus low (n = 129) SDHB, SDHC, and SDHD expression was 0.32, 0.39, and 0.34, respectively (high versus low quartiles, P < 0.001 for each). The DFS HR for high (n = 129) versus low (n = 129) SDHB, SDHC, and SDHD was 0.29, 0.4, and 0.37, respectively (high versus low quartiles, P < 0.001 for each). (Multivariate survival analysis adjusted for stage, grade, age, and sex also revealed a significant increase in survival with higher expression of SDH subunits—shown in SI Appendix, Fig. S5 A–D.)

