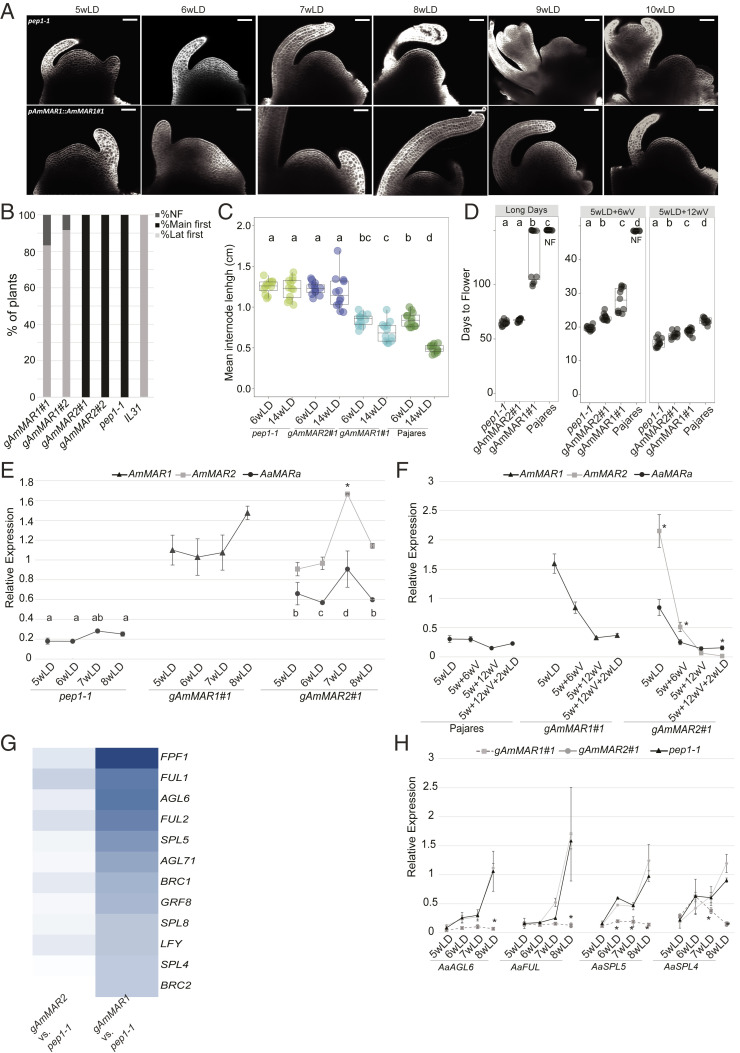
Fig. 4.
AmMAR1 represses floral transition of pep1-1 mutants under LD. (A) Meristem morphology in pep1-1 and gAmMAR1::gAmMAR1 at different time points in long-day conditions. Transgenic plants carrying AmMAR1 are not induced to flower after 10 wk in long days, when pep1-1 mutants have well-developed floral buds. (Scale bar: 50 µm.) (B) Percentage of plants flowering first on the main and lateral shoots. Plants carrying AmMAR1 flowered mainly on secondary lateral shoots, whereas pep1-1 and AmMAR2 plants flowered first on the main shoot. Lat. first, first flower formed on lateral shoot; main first, first flower formed on main shoot; NF, not flowering. (C) Mean internode length for Pajares and late-flowering transgenic plants carrying AmMAR1, compared with that of pep1-1 and pAmMAR2::gAmMAR2 after 6 and 14 wk in long days. Late-flowering plants had shorter internodes. The error bars represent the SD; n = 12. (D) Comparison of the flowering time of transgenic MAR lines, perennial A. alpina Pajares, and pep1-1 without vernalization in long days and after two vernalization periods. pAmMAR1::gAmMAR1 flowers late without vernalization, the reference Pajares never flowers without vernalization, and pep1-1 flowers perpetually. The differences in flowering time are strongly reduced by vernalization and are smaller after vernalization for 12 wk. (E) Levels of AaMARa, AmMAR1, and AmMAR2 mRNA in the main inflorescence apex of AmMAR1 and AmMAR2 transgenic lines and pep1-1 growing for 8 wk in long days. (F) The level of mRNA of PEP1, AaMARa, AmMAR1, and AmMAR2 in apices without vernalization or on exposure to different vernalization periods. Expression of AmMAR genes is strongly repressed after 6 wk of vernalization (n = 12). (G) Heat map of DEGs for flowering time according to the log2-fold change (log2FC) values for pAmMAR1::gAmMAR1 and pAmMAR2::gAmMAR2. All DEGs are listed in Dataset S3. (H) Expression level of selected DEGs in shoot apices after growth for 5 to 8 wk in long days. The data represent the means of two biological replicates, and error bars represent the SD. Asterisks above or below the datapoints indicate significant differences determined by multiple pairwise comparisons using Tukey’s honestly significant difference (HSD) test (P ≤ 0.05). qPCR data are the mean of two biological replicates, and error bars represent the SD. Asterisks above the datapoints indicate significant differences determined by multiple pairwise comparisons using Tukey’s HSD test (P ≤ 0.05).

