Figure 4.
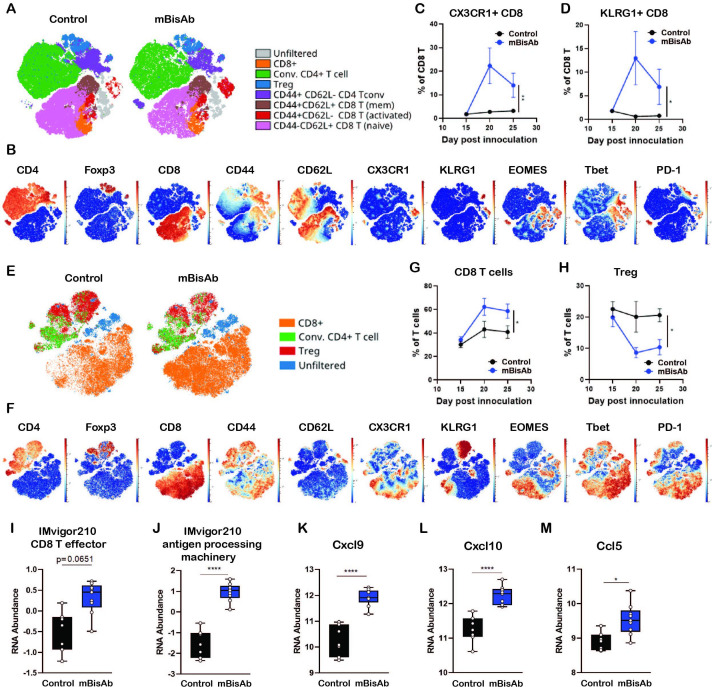
Immunopharmacodynamics of αCD47/PD-L1 mouse surrogate treatment by CyTOF and Nanostring (A–F) MC38-bearing mice were treated with isotype (control) or mBisAb every 3–4 days starting at day 10 post-tumor implantation, and tumors and spleens were harvested at day 15, 20, or 25 and prepared for analysis by CyTOF (n=5 mice/group). (A) ViSNE analysis of total T cells from the spleen of control (left) or mBisAb (right)-treated mice at day 20 post-tumor implantation. Indicated subsets were defined by biaxial gating and position of cells in each subset on the viSNE is represented by a unique color. (B) Expression of indicated markers among total splenic T cells, with each cell in the viSNE colored according to its MMI (mean marker intensity) value of the indicated marker. (C, D) Frequency of CX3CR1+ (C) or KLRG1+ (D) cells among total CD8+ T cells in the spleens of control (black) or mBisAb-treated (blue) mice at the indicated time points. *P<0.05, **p<0.01, Mixed-effects analysis. (E) ViSNE analysis of total T cells from tumors of control or mBisAb-treated mice at day 20 post-tumor implantation. Indicated subsets were defined by biaxial gating and position of cells in each subset on the viSNE is represented by a unique color. (F) Expression of indicated markers among total intratumoral T cells, with each cell in the viSNE colored according to its MMI value of the indicated marker (G, H) Frequency of CD8+ T cells (G) or Tregs (H) among total T cells in control (black) or mBisAb-treated (blue) tumors at the indicated timepoints. *P<0.05, **p<0.01, Mixed-effects analysis. (I–M) MC38-bearing mice were treated with control or mBisAb every 3–4 days starting at day 10 post-tumor implantation. Tumors were harvested at day 20 and prepared for gene expression analysis by Nanostring. Relative RNA abundance of effector CD8+ T cell signature (I) and antigen processing machinery in IMvigor 210 dataset (J). Relative RNA abundance of cxcl9 (K), cxcl10 (L), and ccl5 (M). *P<0.05, ****p<0.0001, Ordinary one-way ANOVA with tukey’s multiple comparison test. ANOVA, analysis of variance; CyTOF, cytometry by time of flight.

