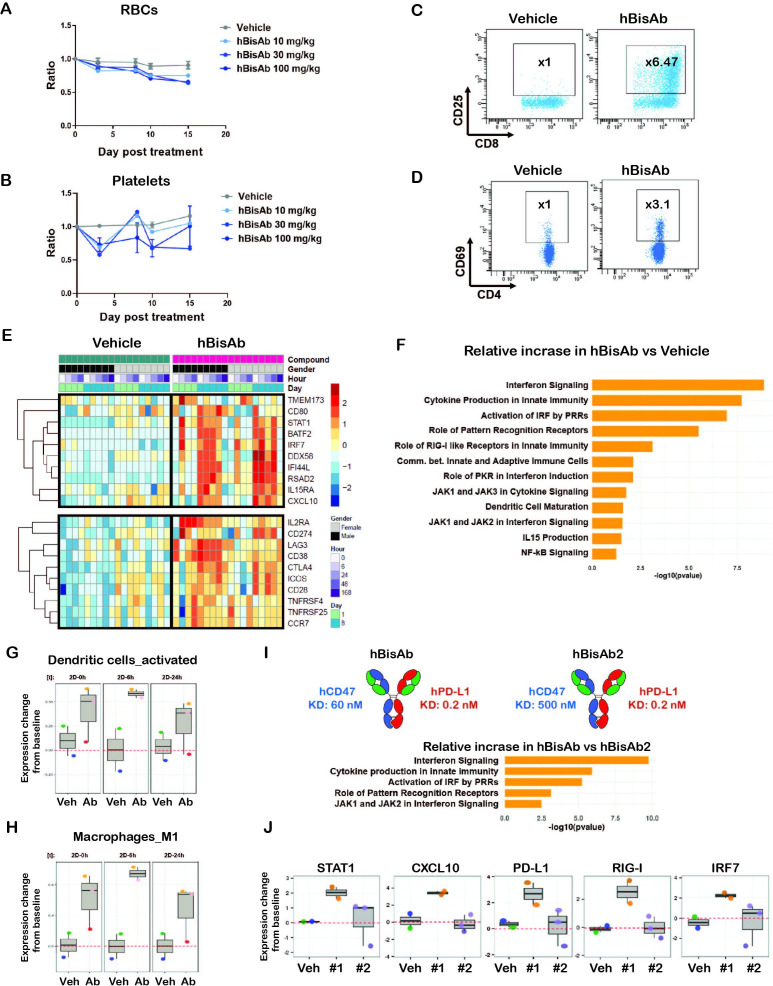
Figure 7.
Non-human primate study with human αCD47/PD-L1 bispecific antibody (hBisAb) treatment. (A, B) Cynomolgus monkeys received vehicle control and 10, 30, and 100 mg/kg of hBisAb on day 1 and 8 (n=1–3 monkey/group). The peripheral blood was collected at the indicated timepoint for RBC (A) and platelet numbers (B) in response to the treatment. Ordinary one-way ANOVA with Dunnett’s multiple comparisons test. (C, D) Representative flow cytometry plots of CD25+ CD4+ and CD69+ CD8+ T cell populations from NHP peripheral blood on day 8 after receiving vehicle control or 100 mg/kg of hBisAb. (E–H) The NHP PBMCs from peripheral blood were collected with the indicated timepoints after receiving vehicle control or 100 mg/kg of hBisAb on day 1 and 8 for RNA-seq analysis (n=2–3 monkey/group). (E) Selected DEGs associated with innate and adaptive immune pathways in vehicle-treated versus hBisAb-treated samples across all the timepoints during a 2-week period. (F) IPA pathway analysis of the RNA-seq from hBisAb-treated compared with vehicle-treated group on 6 hours post-second dose on day 8. (G, H) LM22 gene signature scores (relative to baseline) of activated DCs and M1 macrophages in vehicle (Veh) vs hBisAb (Ab)-treated group on 0, 6, and 24 hours post-second dose (2D). (I, J) The peripheral blood from cyno received 100 mg/kg of hBisAb and hBisAb2 with reduced CD47 affinity on day 1 and 8 (n=2–3 monkey/group) was collected for RNA-seq analysis. The molecule affinity and enriched IPA pathway scores (I) as well as the selected DEGs (J) expression profiles are listed for the comparison of the two antibodies. 2D, two dimensional; ANOVA, analysis of variance; DC, dendritic cell; DEG, differentially expressed gene; NHP, non-human primate; PBMC, peripheral blood mononuclear cell; RBC, red blood cell.

