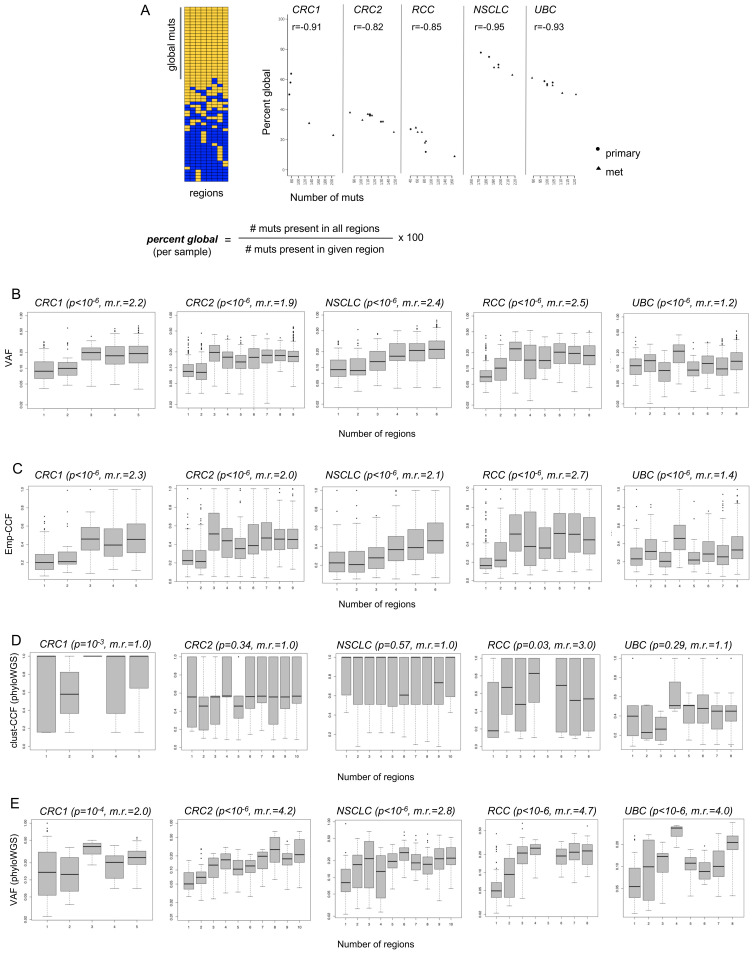
Figure 4.
Predictive value of individual tumor samples for globally clonal mutations, and comparison of variant allele frequencies (VAF), emp-cancer cell fraction (CCF), and clust-CCF with mutation presence across tumor regions. (A) Multiregion sequencing (MR-seq) can inform tissue sampling for neoantigen-specific immunotherapy (iNeST). The ‘per cent global’ statistic can also be used as a measure of predictive value for each tumor region for globally clonal mutations (those found in all regions). Primary samples generally had higher predictive value for clonal mutations than metastasis samples did. Mets tended to have more mutations (p=0.03), consistent with later clone emergence. Some lymph node samples suffered from severe underdetection of mutations due to inadequate tumor tissue area, and were removed from all analyses (see ‘Methods’ section). (B) VAF are plotted for mutations found in different numbers of regions for each case. The VAF distribution for singleton mutations (those found in just one region) are at the left-most x-axis position, and the VAF distribution for globally clonal mutations (those found in all regions) are at the right-most x-axis position of each box plot as the number of regions increases from left to right on the x-axis. The p value from a Kruskal-Wallis test (VAF ~num_regions) is indicated in parentheses next to each case name, as well as the ratio of median VAF for clonal mutations divided by the median VAF for singleton mutations (‘m.r.’). (C) Empirical cancer cell fractions (emp-CCF), as calculated using Eq. 4 (see ‘Methods’ section) are plotted for mutations found in different numbers of regions for each case. Results from similar analyses as performed in (B) are shown, with p values from Kruskal-Wallis tests (emp-CCF ~num_regions). (D) Cancer cell fractions (CCF) determined by phyloWGS are plotted for mutations found in different numbers of regions for each case. Results from similar analyses as performed in (B) and (C) are shown, with p values from Kruskal-Wallis tests (clust-CCF ~num_regions) and the ratio of median clust-CCF for global mutations divided by the median VAF for singleton mutations (‘m.r.’). (E) VAF from the set of mutations passed to phyloWGS are plotted for mutations found in different numbers of regions for each case.

