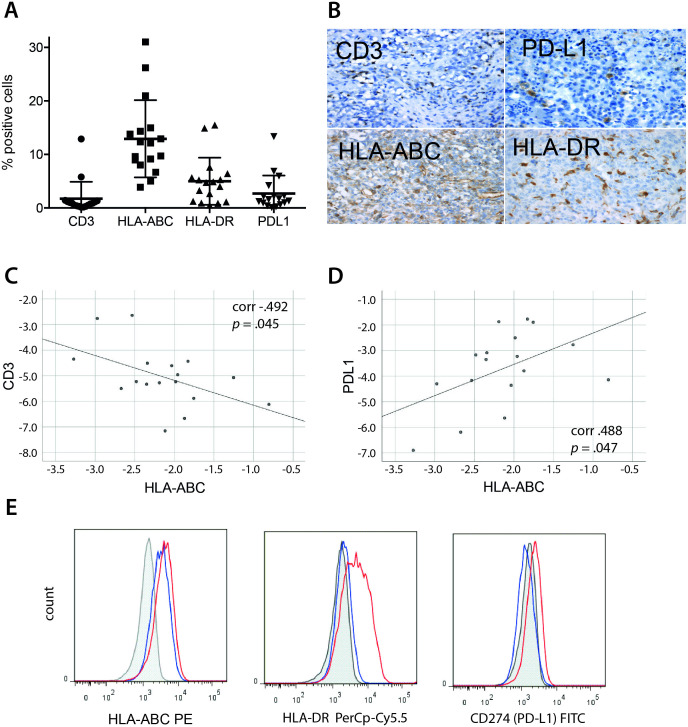
Figure 1.
Immunohistochemistry of AT/RT tissues. Seventeen AT/RT tissues were evaluated for expression of CD3, HLA-ABC, HLA-DR, and PD-L1 on tumor cells. (A) Mean values±SD for all four markers, 10 visual fields were evaluated in each tumor sample. (B) Representative examples for each of the four markers. (C and D) Linear regression analysis of HLA-ABC expression against CD3+ T cell infiltration (C) and PD-L1 expression (D). Data are plotted after logit-transformation, correlation coefficient r indicates strength and direction of the concordance, the p value specifies the difference of r from 0. (E) Flow cytometric analysis of one primary rhabdoid cell line. Shaded line represents unstained control, blue line represents constitutive expression, red line represents expression after IFNγ stimulation of tumor cell line. AT/RT, atypical teratoid/rhabdoid tumor.

