Figure 1.
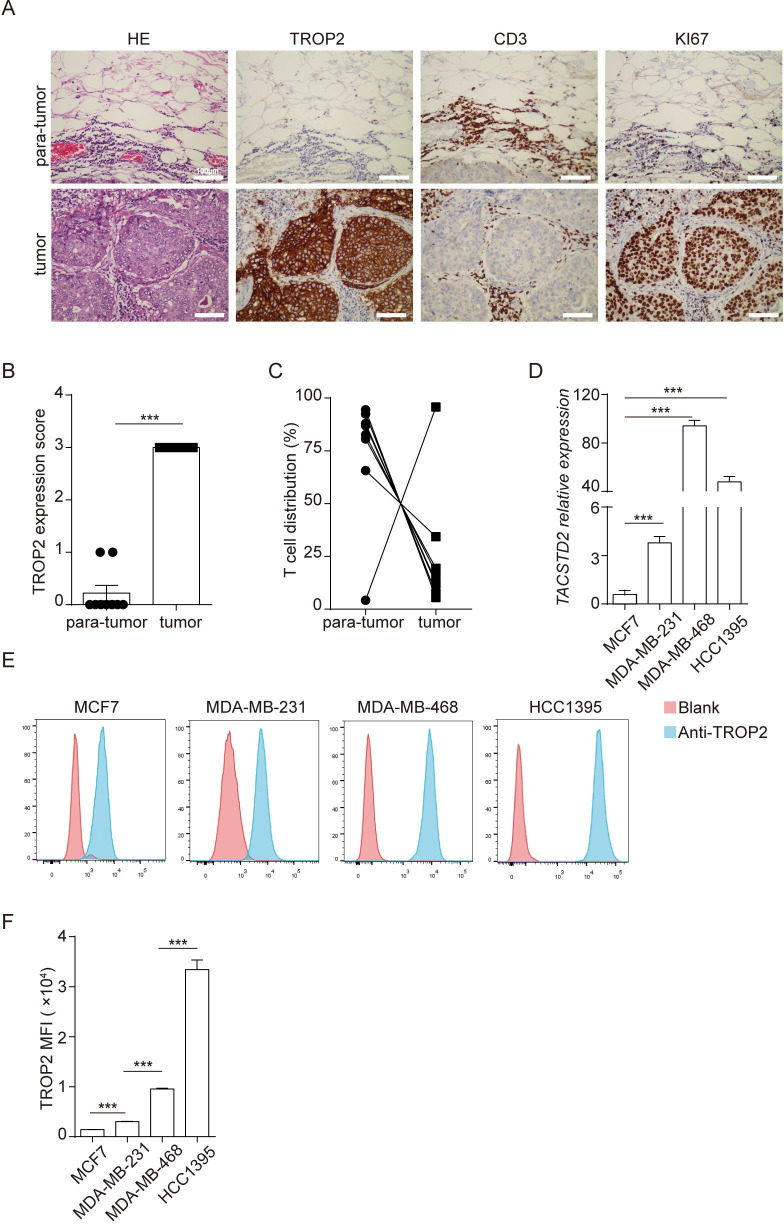
TROP2 is highly expressed in TNBC tumor tissues and cells. (A) H&E and IHC staining of TROP2, CD3 and KI67 in TNBC tumor and paratumor tissues and representative images are shown (n=9). Scale bar, 100 µm. (B) TROP2 expression scores in TNBC tumor and paratumor tissues measured by IHC (n=9). (C) The percentages of T cells in TNBC tumor and paratumor tissues measured by IHC staining with anti-CD3 antibody (n=9). (D) Quantitative PCR analysis of TACSTD2 expression in four breast cancer cell lines. (E) TROP2 expression in four breast cancer cell lines was determined by flow cytometry using anti-TROP2 (Biolgend, 363804) and histograms of the MFI (median fluorescence intensity) of TROP2 from three experiments were shown (F). Experiments were repeated for three times (D–E). Significance measured by unpaired t test (C) and one-way ANOVA (F). Mean±SEM; *p<0.05; **p<0.01; ***p<0.001. ANOVA, analysis of variance; IHC, immunohistochemistry; TNBC, triple negative breast cancer; TROP2, trophoblast cell surface antigen 2.

