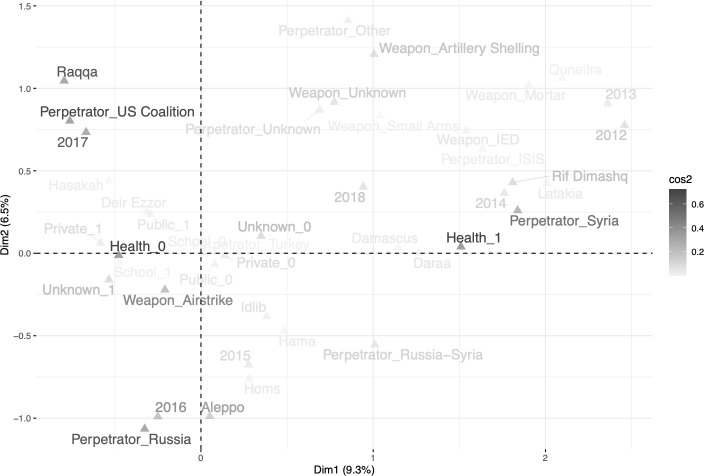
Figure 3.
Multiple correspondence analysis squared cosine distance (cos2) plot. Very high confidence of point placement is labelled with darker text, high confidence placement with grey and moderate confidence with light grey text. Note disparate locations of whether healthcare was attacked (Health 1) or not (Health 0) along the x-axis.

