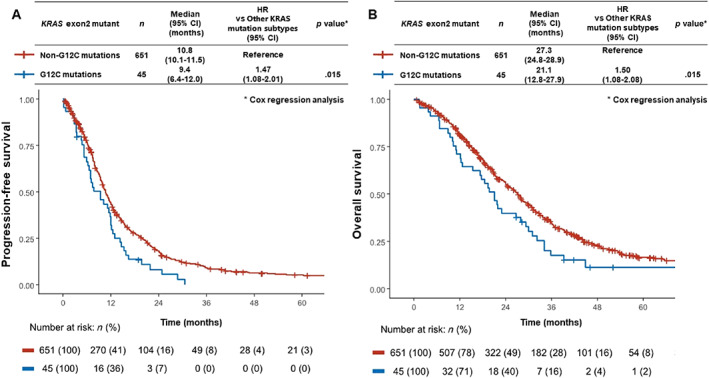
Figure 4.

Kaplan‐Meier curves for progression‐free survival (PFS) and overall survival (OS) in KRAS G12C mutation versus non‐G12C mutations. (A): Median PFS in patients with KRAS G12C mutation was significantly shorter than that in patients with non‐G12C mutations (9.4 months [95% CI, 6.4–12.0] vs. 10.8 months [95% CI, 10.1–11.8]; HR, 1.47 [95% CI, 1.08–2.01], p = .015). (B): Median OS in patients with KRAS G12C mutation was significantly shorter than that in patients with non‐G12C mutations (21.1 months [95% CI, 12.8–27.9] vs. 27.3 months [95% CI, 24.8–28.9]; HR, 1.50 [95% CI, 1.08–2.08], p = .015).
Abbreviations: CI, confidence interval; KRAS, Kirsten rat sarcoma; HR, hazard ratio.
