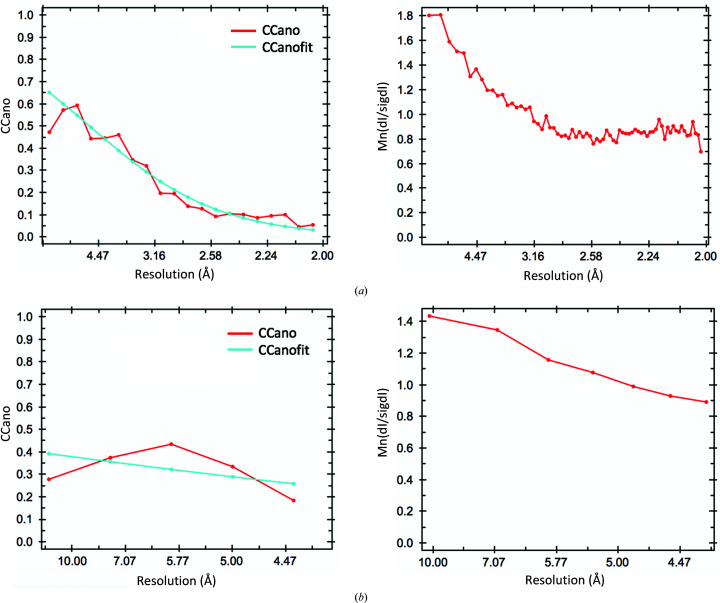
Figure 3.
Analysis of the anomalous signals using AIMLESS (manual). (a) CCano (left) and Mn(dI/sigdI) (right) as a function of resolution for the bromide data set. (b) CCano (left) and Mn(dI/sigdI) (right) as a function of resolution for the SeMet data set. The figures were automatically generated during manual data processing using AIMLESS.

