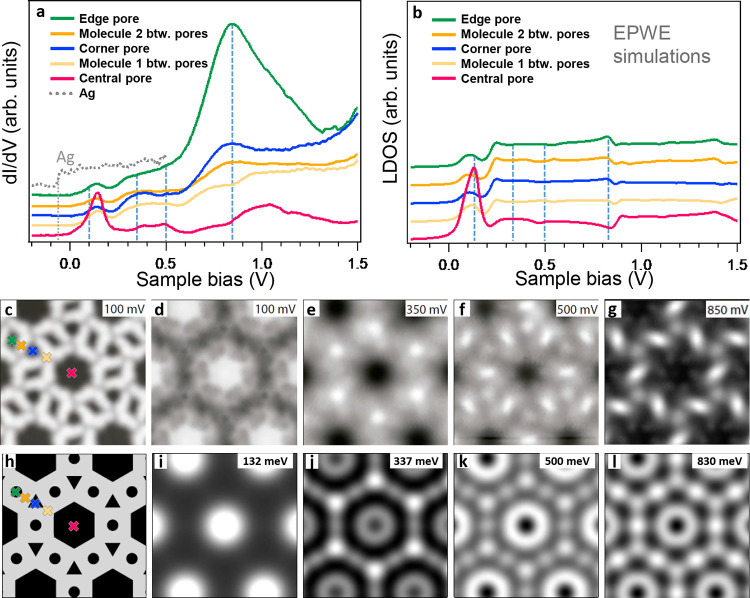
Figure 2.
Measured LDOS of the network and corresponding EPWE simulation. (a) The dI/dV curves measured at the center of the three pore types and at neighboring molecules. The gray dotted line corresponds to the pristine Ag(111) reference, displaying the surface state onset at −68 mV. (b) LDOS spectra simulated by EPWE at the corresponding experimental sites. (c) STM topography of the multiporous network and the corresponding dI/dV maps at different energies in (d–g). (h–l) LDOS maps simulated by EPWE using a realistic geometry (see Figure S2). The crosses in (c) and (h) indicate the positions where the spectra shown in (a) and (b) are taken. Measurement parameters: V = 100 mV/I = 200 pA for (c); I = 200 pA in (d–g) with lock-in parameters Vrms = 7 mV. EPWE parameters: VAg = 0 mV (in black), Vmolecules = 255 mV (in gray), ESS = −70 meV, m* = 0.39 me.

