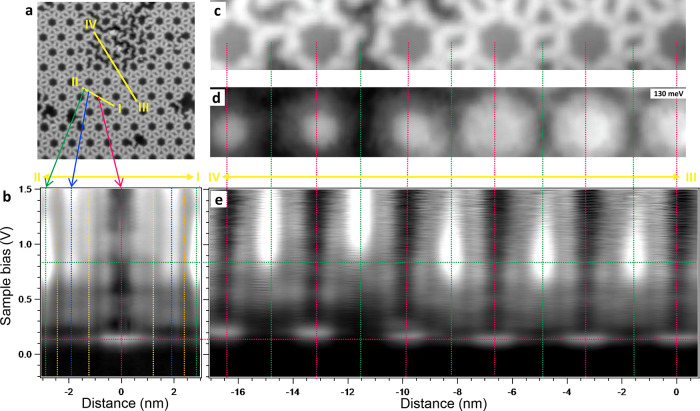
Figure 4.
Linescans and defect-induced modifications upon the pore states. (a) STM topography of the network region defining the two linescans acquired (yellow lines). The defective region at the top was generated by selective tip-induced debromination (Figure S3). (b) Logarithmic grayscale dI/dV linescan along the direction connecting the three types of pores (I–II). The vertical lines mark the center of the pores and the molecular positions corresponding to Figure 2a. (c) Simultaneously obtained STM topography and (d) dI/dV map at the energy of the ncentral = 1 SS resonance maximum that includes a defective area at the left part. (e) Logarithmic grayscale dI/dV linescan connecting the central and edge pores (marked with vertical lines) along the III–IV trajectory. The horizontal lines are a guide to the eye for the energy position of the network’s ncentral = 1 SS resonance (red) and the SAMO state (green). Measurement parameters: V = −200 mV/I = 100 pA in (a); V = 130 mV/I = 200 pA in (c) and (d); the set point in (b) and (e) is V = −200 mV and I = 100 pA with lock-in parameter Vrms = 7 mV.

