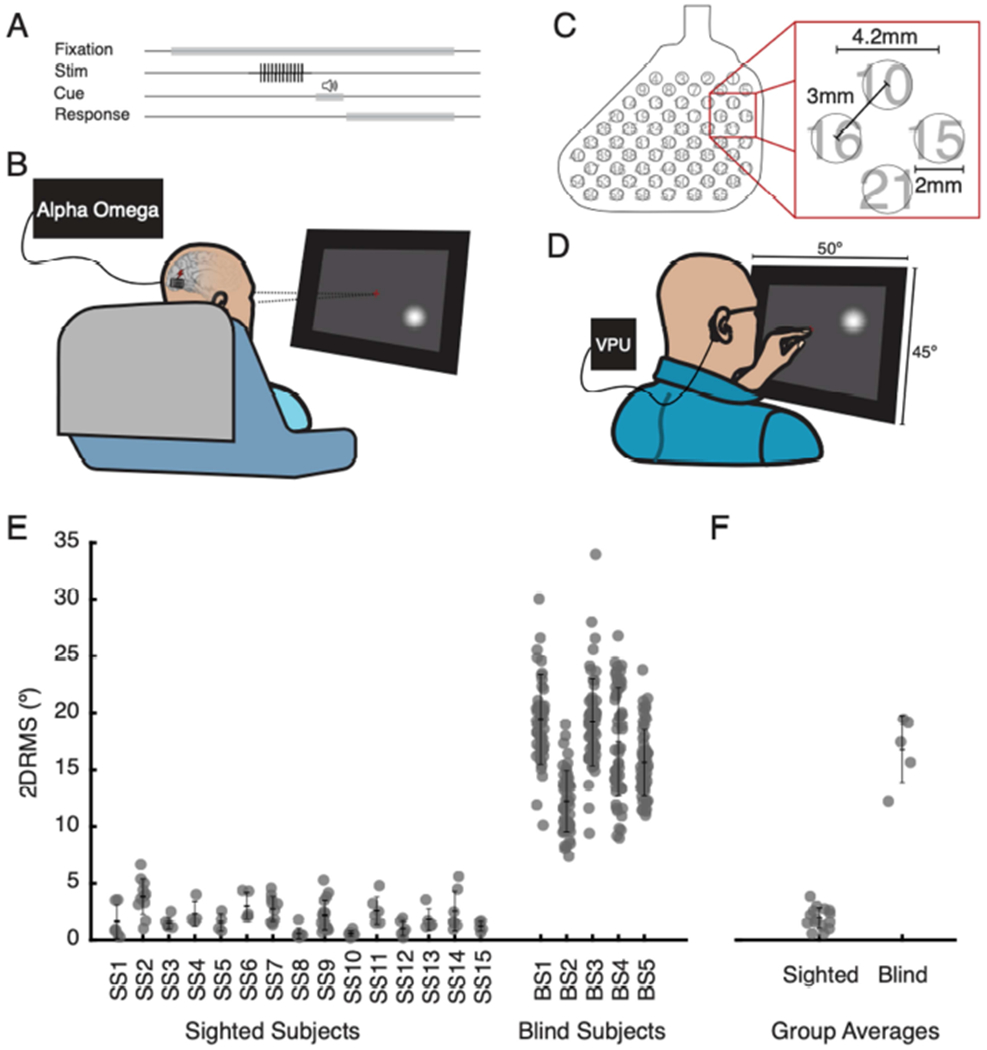
Figure 1.

Discrepancy in reported phosphene precision between sighted and blind subjects. A. Task flow. Subjects were instructed to fixate on a point on a touchscreen monitor placed in front of them at eye level, while a pulse train of electrical stimulation was delivered to a single electrode. An auditory tone indicated the end of stimulation and cued subjects to report the phosphene location. B. Sighted subjects conducted tasks seated in their hospital bed and directed their gaze toward a centrally located fixation cross. Stimulation was delivered by an Alpha Omega neural stimulator. Subjects reported location of phosphenes on touchscreen display. C. Electrode array implanted in blind subjects. Contact numbers are indicated from 1 (upper right) to 60 (lower left). D. Blind subjects were seated in a chair in a laboratory testing room and fixated by placing their left index finger on a tactile point on the monitor. Electrical stimulation was delivered by the Visual Processing Unit (VPU) of their Orion VCP. Subjects indicated the location of the perceived phosphene with their right index finger. E. Precision in reported phosphene location, quantified as 2DRMS, for individual sighted (SS1 – SS15) and blind subjects (BS1 – BS5). Each data point reflects 2DRMS for an individual electrode. Error bars indicate mean and one standard deviation. F. Group precision (sighted vs. blind) data. Each point reflects the average precision (2DRMS) for a subject, across all electrodes evaluated for that subject. Error bars indicate group average and standard deviation.
