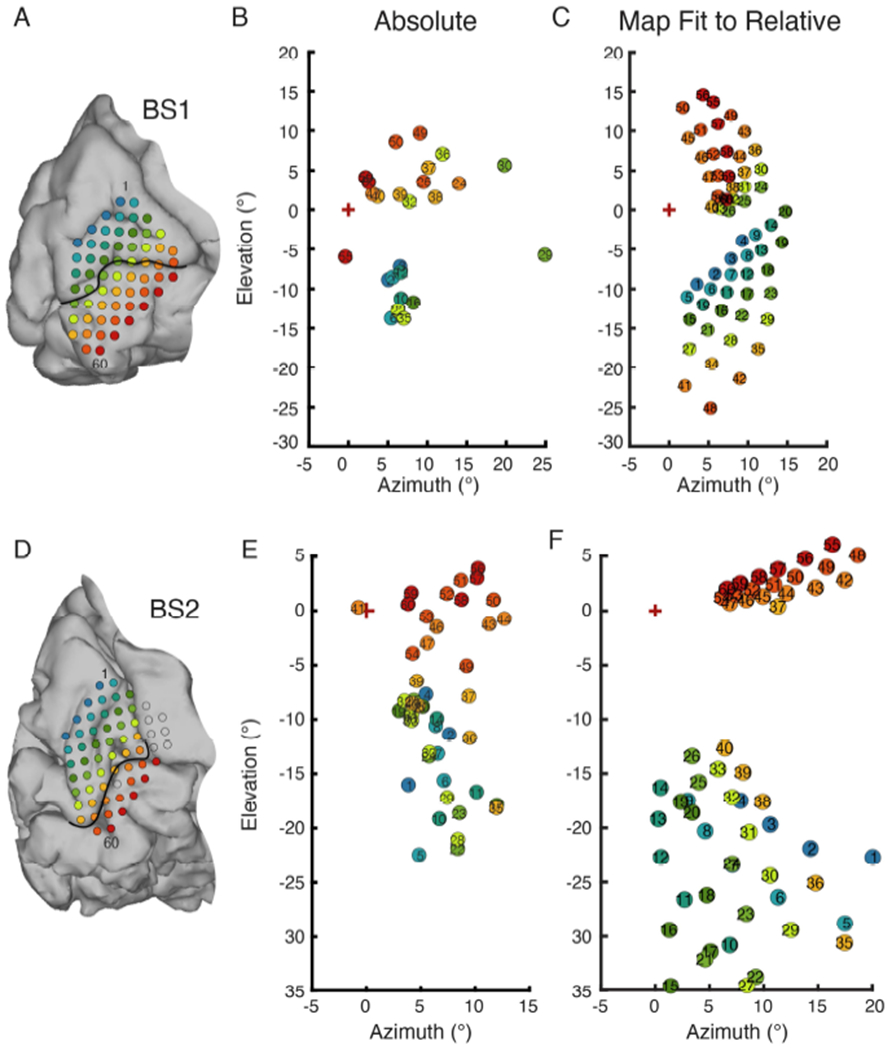
Figure 10.

Comparison of overall map of visual space obtained by absolute mapping and visual space map fit to relative mapping with multi-point data. A. Array placement on the medial wall for BS1. Electrode 1 is indicated in the superior - anterior position, and electrode 60 in the inferior posterior direction. B. BS1 phosphene map generated by absolute mapping. C. BS1 visual filed map made by fitting a model of the V1-V3 complex to phosphene locations determined through relative multi-point mapping. D. Array placement for BS2. E. BS2 absolute phosphene map. F. BS2 visual filed map generated by fitting a model of the V1-V3 complex to multi-point sequence data.
