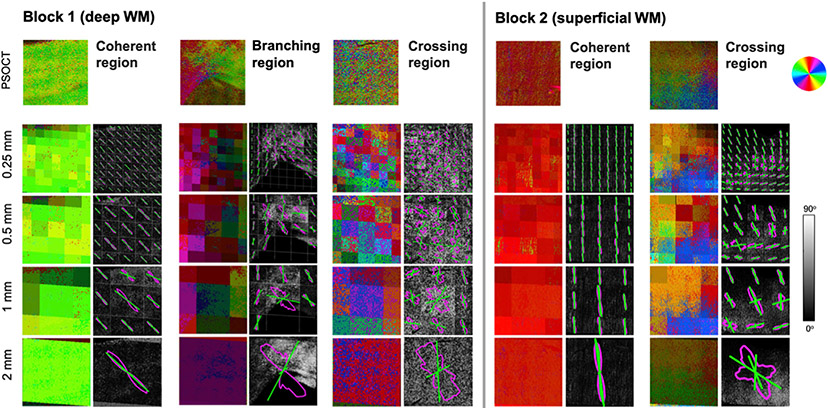
Fig. 10. PSOCT FODs vs. dMRI orientations in ROIs with different fiber configurations.
Orientation vectors measured by PSOCT (top) and those estimated from dMRI at each spatial resolution (bottom) are shown as colormaps (see color wheel at top right). PSOCT FODs (magenta outlines) and all dMRI peaks (green lines) from each voxel are shown overlaid on grayscale maps of angular error between dMRI and PSOCT.

