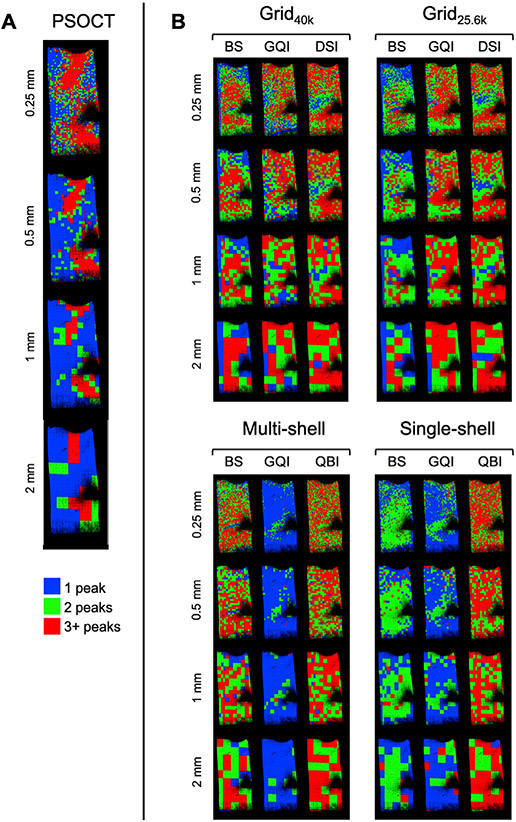
Fig. 12. Number of fiber populations detected by PSOCT and dMRI in a superficial WM sample.
The color maps show the number of peaks in the PSOCT FODs (A, left) and the number of peaks detected with each dMRI reconstruction method (B, right) at different spatial resolutions (blue = 1 peak, green = 2 peaks, red = 3+ peaks).

