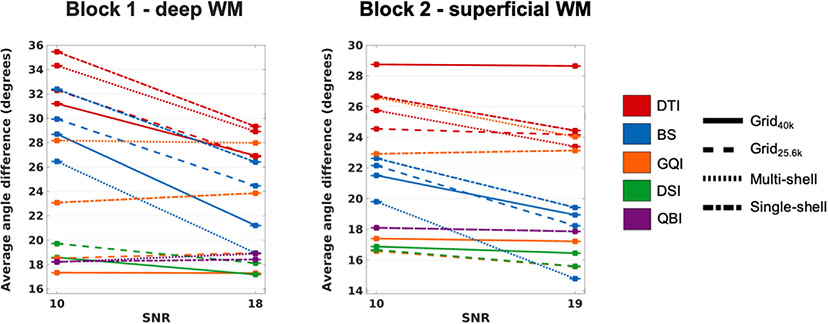
Fig. 14. Effect of added noise on the accuracy of dMRI orientation estimates.
The plots show the absolute angular error, averaged over all included WM voxels from all PSOCT sections in each sample, as a function of the SNR, at 1 mm spatial resolution. Line styles represent different q-space sampling schemes. Line colors represent different orientation reconstruction methods.

