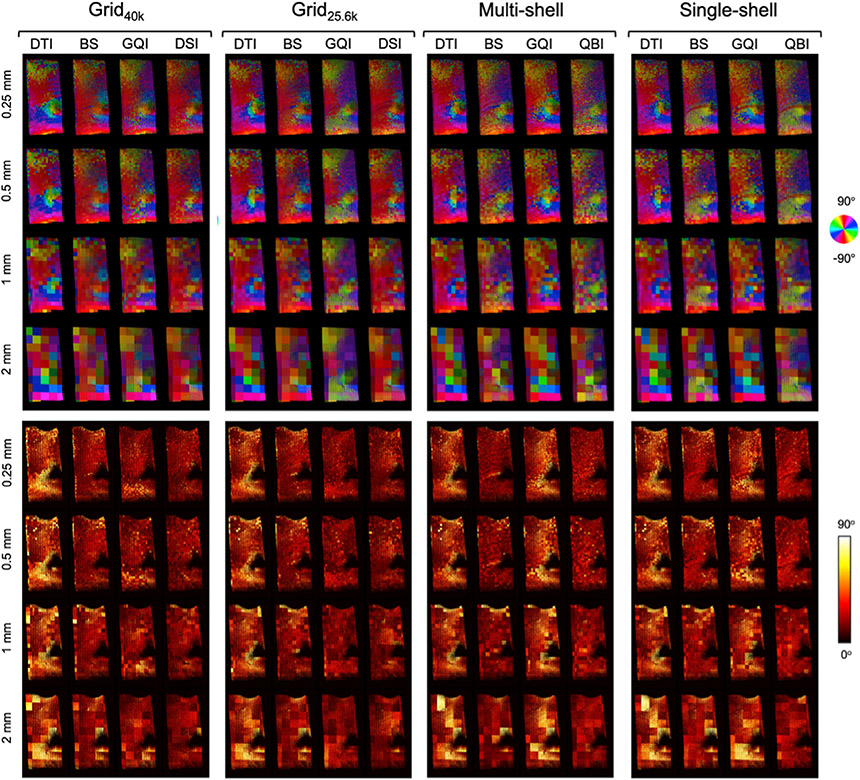
Fig. 7. Axonal orientations estimated from dMRI in a superficial WM sample.
Top: Color-coded maps of the orientations obtained from dMRI that match the ones from the PSOCT data (Fig. 3) most closely, for each q-space sampling scheme, orientation reconstruction method, and spatial resolution. Bottom: Absolute angular error between orientations estimated from dMRI and measured with PSOCT.

