
Figure 3.
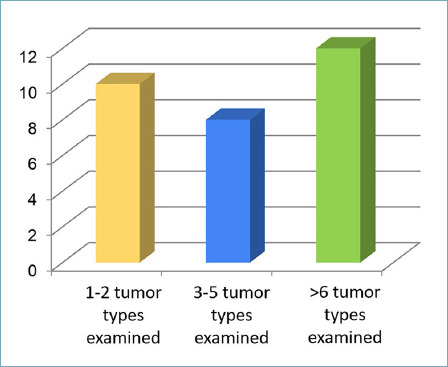
Color Graph showing the diagnostic activity of centers categorized by the number of different tumor types investigated by NGS.
Official websites use .gov
A
.gov website belongs to an official
government organization in the United States.
Secure .gov websites use HTTPS
A lock (
) or https:// means you've safely
connected to the .gov website. Share sensitive
information only on official, secure websites.
Color Graph showing the diagnostic activity of centers categorized by the number of different tumor types investigated by NGS.