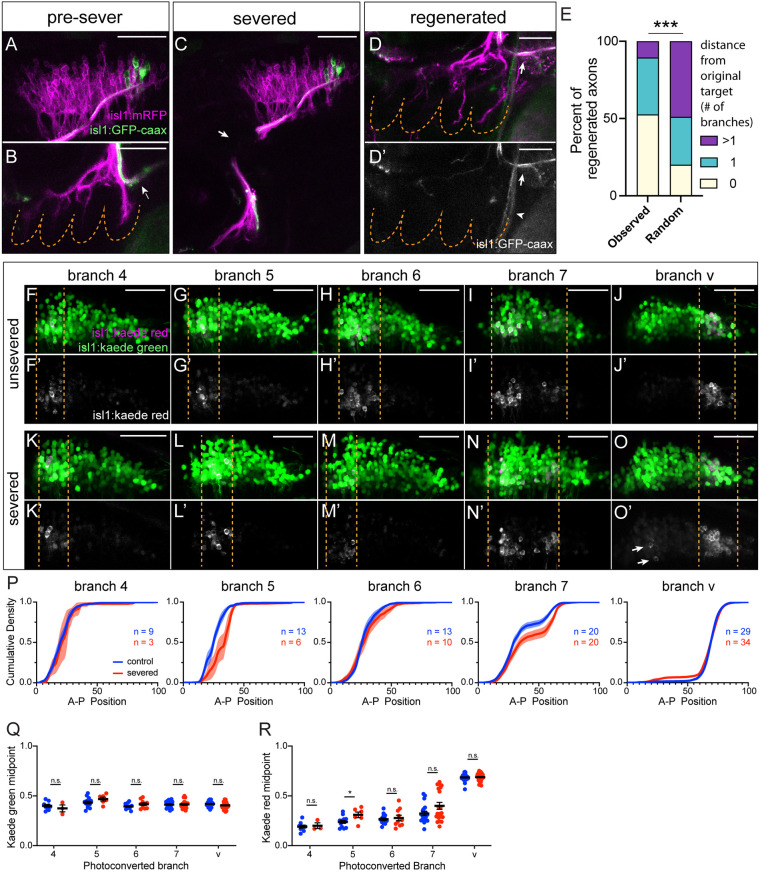
Fig. 2.
Target-specific vagus nerve regeneration after laser axon severing. (A,B) Sparsely labeled vagus neurons (green) (A) targeting branch v (arrow) (B) prior to severing at 3 dpf. (C) Severed vagus nerve at 3 dpf. Arrow indicates sever site. (D,D′) The same animal at 3 dps. Branches have regenerated, and green labeled axons (white in D′) have re-targeted to branch v (arrows). Arrowhead indicates autofluorescence of cleithrum bone. In B,D,D′, dashed lines denote PAs. (E) Frequency of re-targeting of sparsely labeled regenerated axons to a branch 0, 1 or >1 branches away from the original target, observed distribution (n=19) versus expected distribution assuming random branch selection. ***P=0.0004 (Chi-squared test). (F-O) Vagus topographic organization measured by cell backfills after photoconversion (magenta) of individual branches 4 (F,K), 5 (G,L), 6 (H,M), 7 (I,N) and v (J,O) in unsevered (F-J) and severed (K-O) larvae at 6 dps. (F′-O′) Photoconverted channel only. Dashed lines denote anterior and posterior boundaries of backfilled regions. Individual neurons with topographically incorrect re-targeting are occasionally observed in regenerated nerves (arrows in O′). (P) Anterior-to-posterior cumulative densities of Kaede red fluorescence in the vagus nucleus after photoconversion of each branch. Shaded area indicates s.e.m. (Q,R) Cumulative density midpoints of Kaede green fluorescence (Q) and Kaede red fluorescence (R) in the vagus nucleus after photoconversion of each branch. Error bars represent mean with s.e.m. *P<0.05; n.s., not significant (unpaired two-tailed t-test). All images are maximum intensity projections of lateral views with anterior to left. Scale bars: 50 µm.

