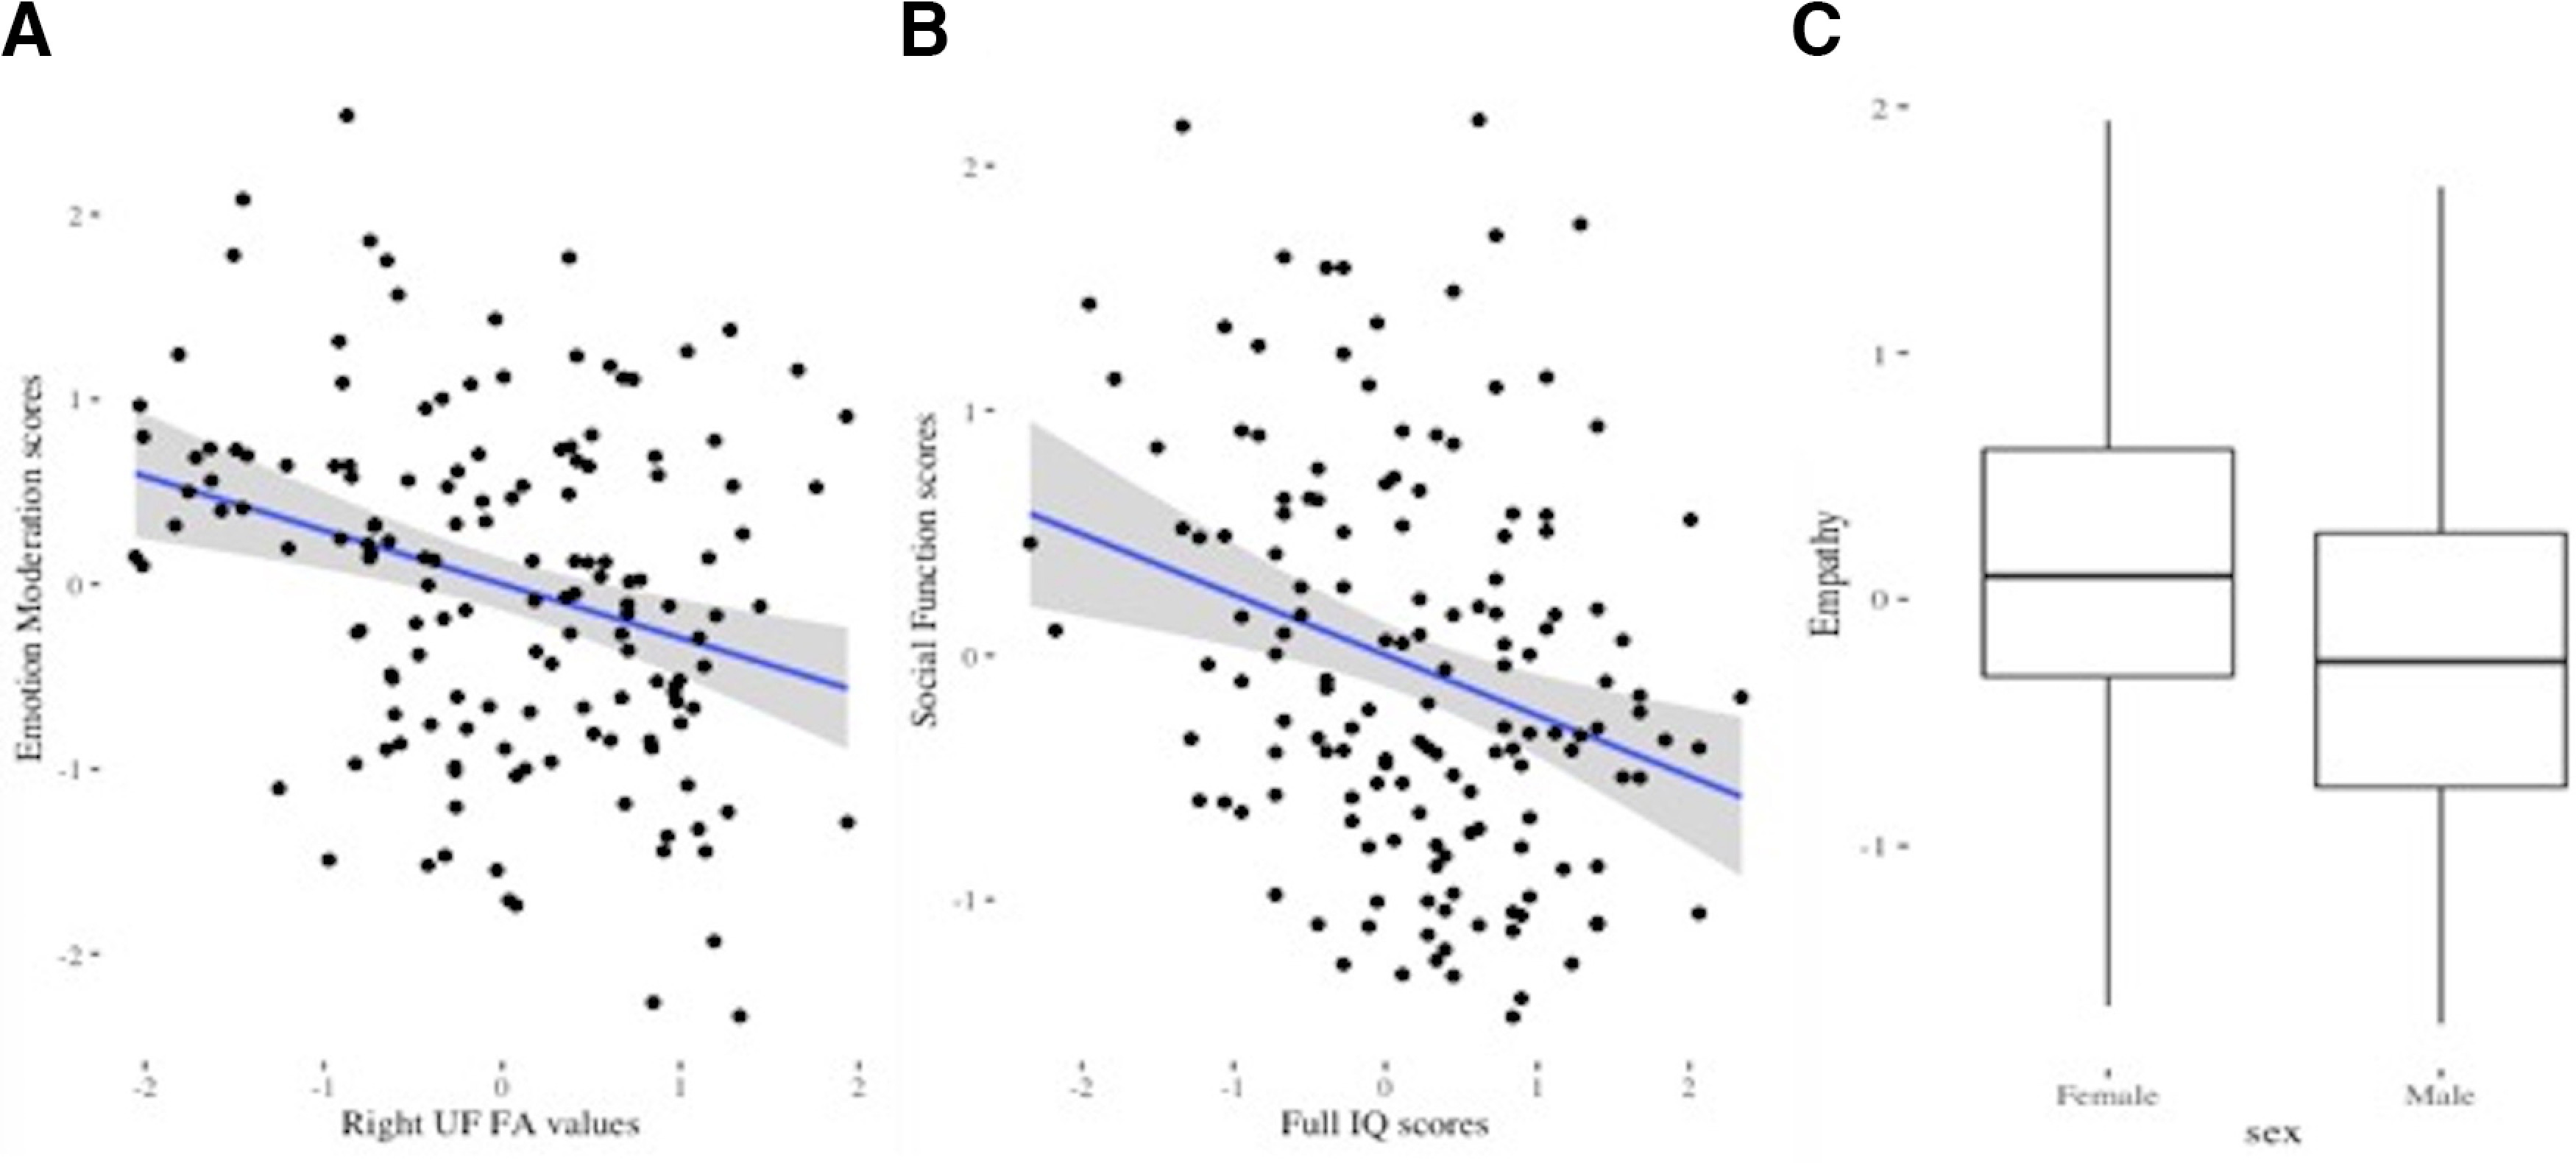
Figure 4.

A, Scatterplot showing negative relationship between right UF FA values and emotion moderation scores (one outlier removed, total n = 150). B, Scatterplot showing negative relationship between IQ scores and social function scores (one outlier removed, total n = 150). C, Boxplot showing sex differences in empathy scores. Outliers were defined as values >1.5 times the value of the interquartile range beyond the quartiles. All values were scaled prior to analyses.
