Figure 2.
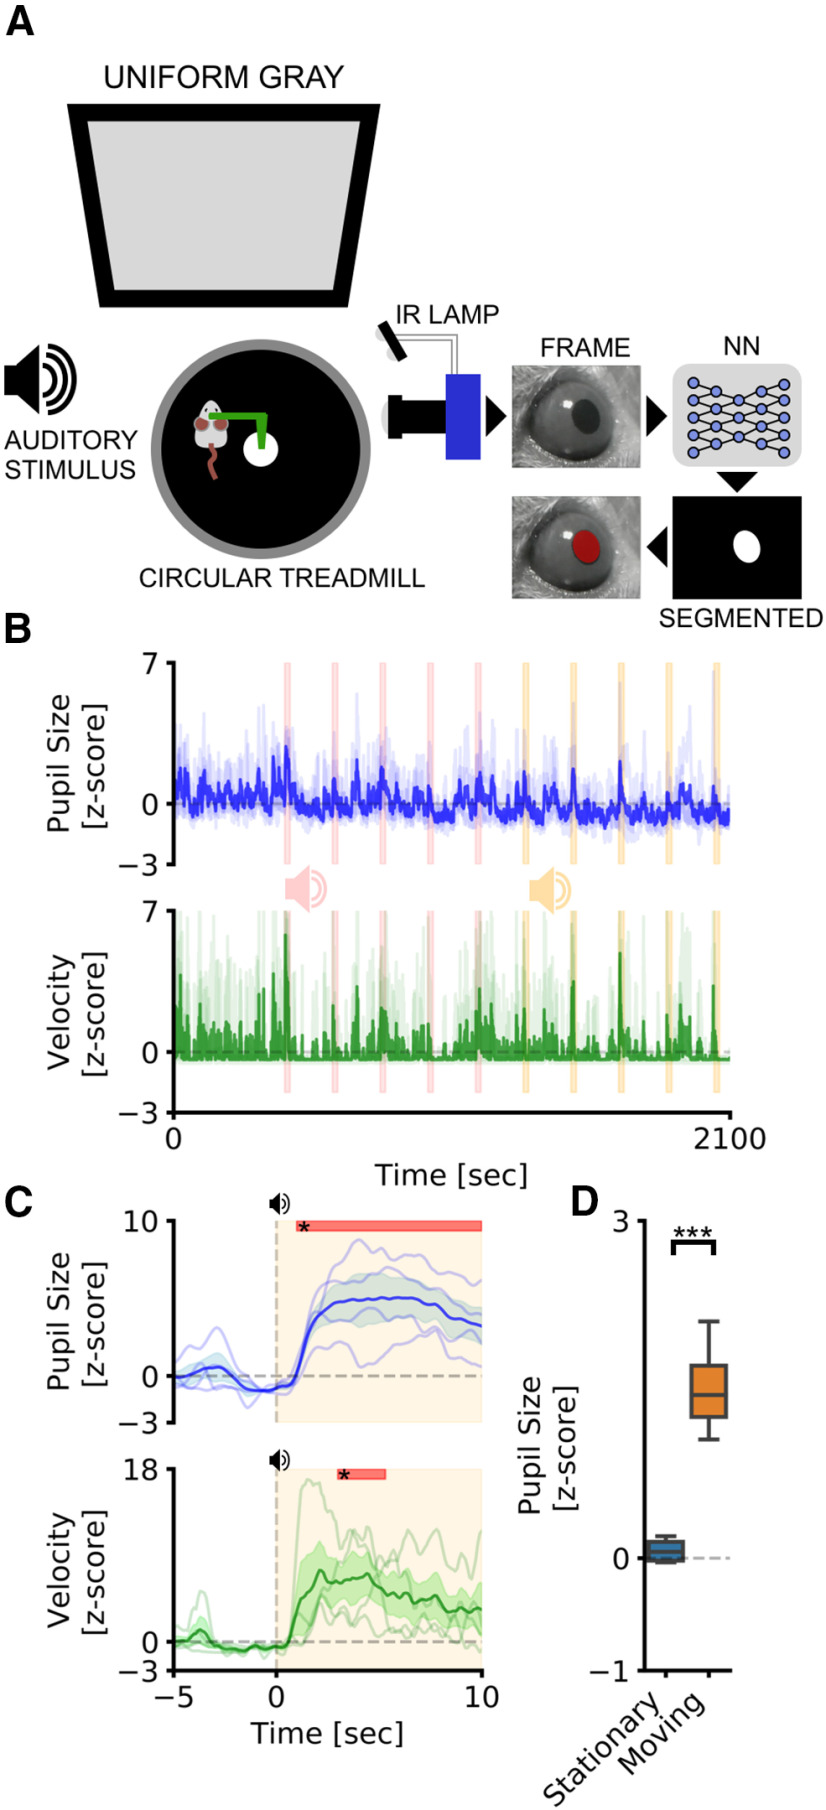
Pupillometry in head-fixed mice. A, Setup for head-fixed pupillometry in the awake mouse. The head of the mouse is fixed to a custom-made metal arm equipped with a 3D-printed circular treadmill to monitor running behavior. In the meantime, pupillometry is performed using CNN. B, The average fluctuations of pupillometry and velocity in all experimental mice. Dashed pink and yellow areas represent the onset and duration of auditory stimuli. Evoked peaks in both pupil size (blue line) and velocity (green line) are clearly noticeable during auditory stimulation. C, Average event-related transients for both pupil size and velocity. Colored areas represent stimulus onset and duration. Red areas in the top part of the plot represent statistically significant data points. D, Sensibility of the system to detect locomotor-induced arousal fluctuations. Average pupil size is significantly affected by the behavioral states of the animal. During running epochs (Moving) the pupil is significantly more dilated than during the resting state (Stationary). ***p > 0.001.

