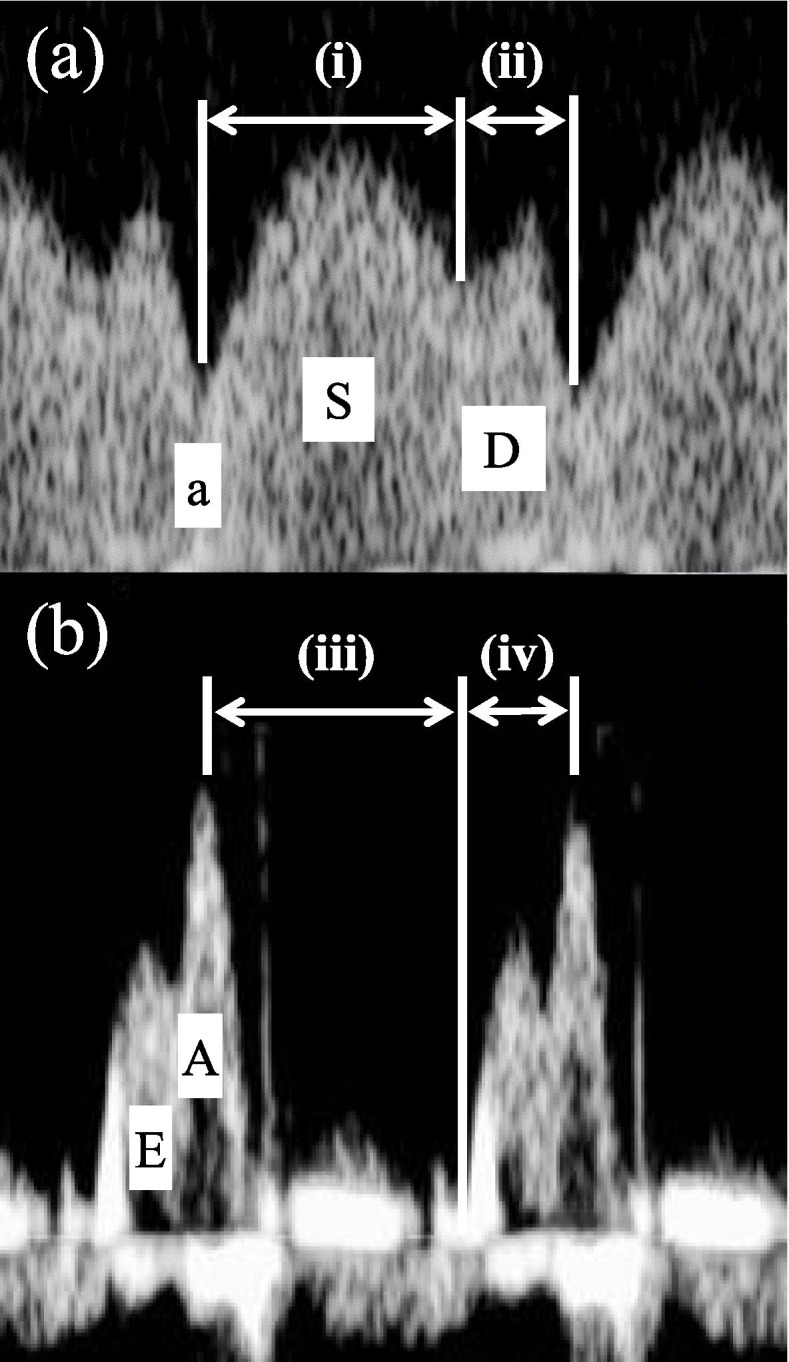
Fig. 1.

Doppler tracings of flow velocity waveforms (FVW) of ductus venosus (DV) (a) and ventricular inflow (b). (i) indicates time interval for S-wave of DV-FVW, measured from nadir of a-wave during atrial contraction to nadir between S-wave and D-wave; (ii) indicates time interval for D-wave of DV-FVW, measured from nadir between S-wave and D-wave to nadir of a-wave; (iii) indicates time interval from the second peak of ventricular inflow caused by atrial contraction (A-wave) to the opening of the tricuspid and mitral valves; (iv) indicates time interval from the opening of the tricuspid and mitral valves to the peak of the A-wave. (i)/(ii) expressed as DV-S/D. (iii)/(iv) was expressed as TV-S/D for tricuspid valve, and MV-S/D for mitral valve, respectively
