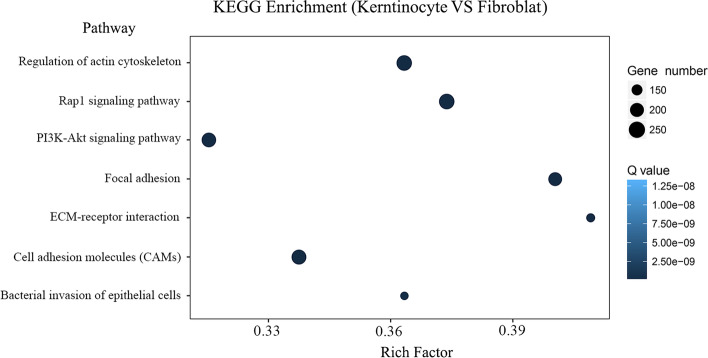
Fig. 4.
Scatter plot of KEGG enrichment of differential genes. To investigate the main functional pathway of DEGs, KEGG enrichment analysis was carried out. The vertical axis represents the name of the pathway, the horizontal axis represents the rich factor, and the dot size indicates the number of differentially expressed genes in this pathway. The color of the points corresponds to different Q value ranges. Rich factor refers to the ratio of the number of differential genes (sample number) enriched in the pathway to the number of annotation genes (background number). A greater Rich factor value indicates greater enrichment

