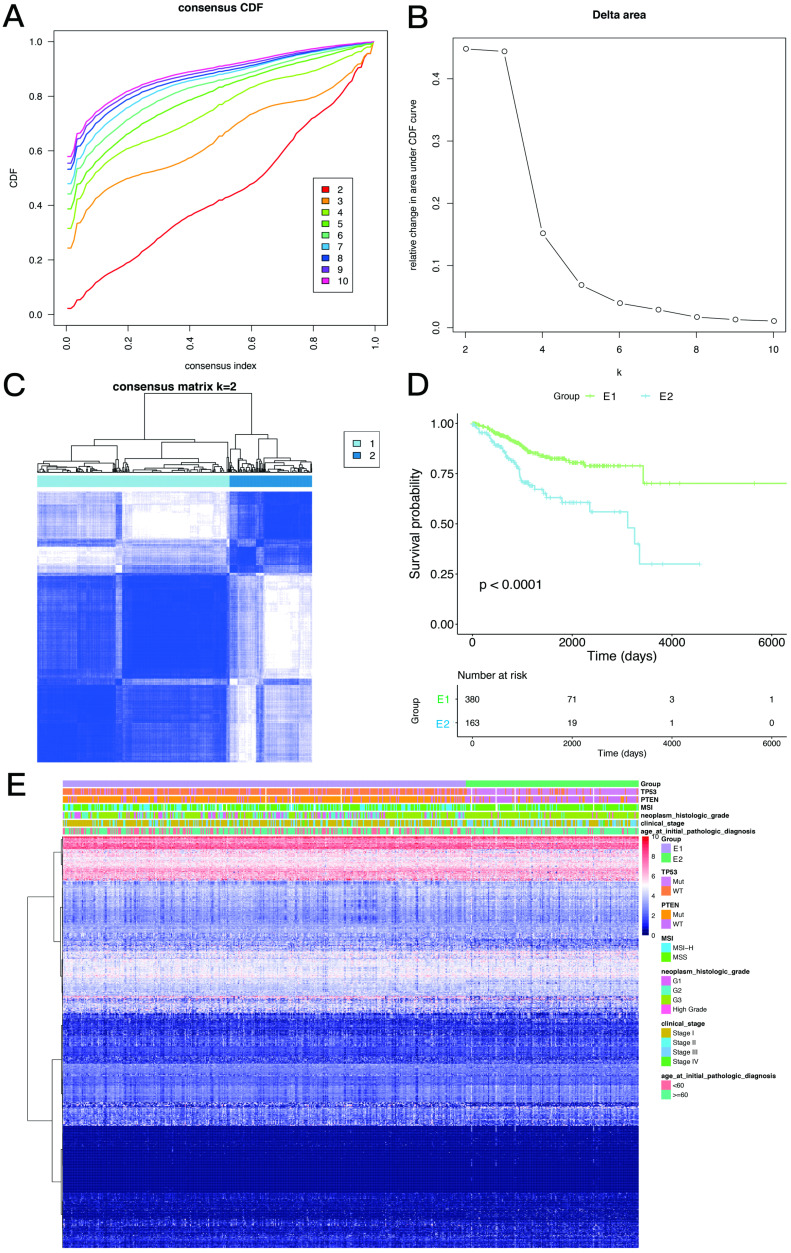
Figure 3.
Consistency clustering of EMT-related genes. A,B. Clustering cumulative distribution function and relative change in area under the Cumulative Distribution Function (CDF) curve. C. Correlation between the EMT-1 (E1) and EMT-2 (E2) subgroups. D. Kaplan-Meier survival curves for both groups. E. Heat maps depicting the expression levels of EMT-related genes in both sample groups.

