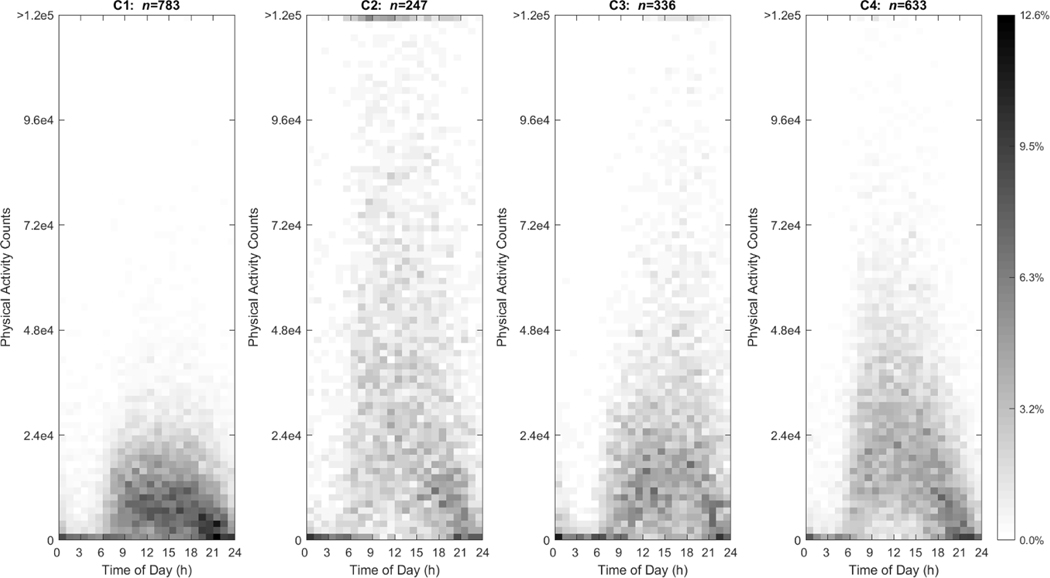
Fig. 1.
Heat maps for CDTW clusters (A-D) which depict activity counts ranging from 0 counts/hour (cph) to > 1.2e5 cph (y-axis) for U.S. adults ages 20–65 y as drawn from NHANES 2003–2006 over a 24-hour day from time 0=12:00 to 24:00 the next day (x-axis). The proportion of the sample is indicated by the inverse gray-scale legend with 0.0% of the cluster participants to 12.6% of the cluster participants.

