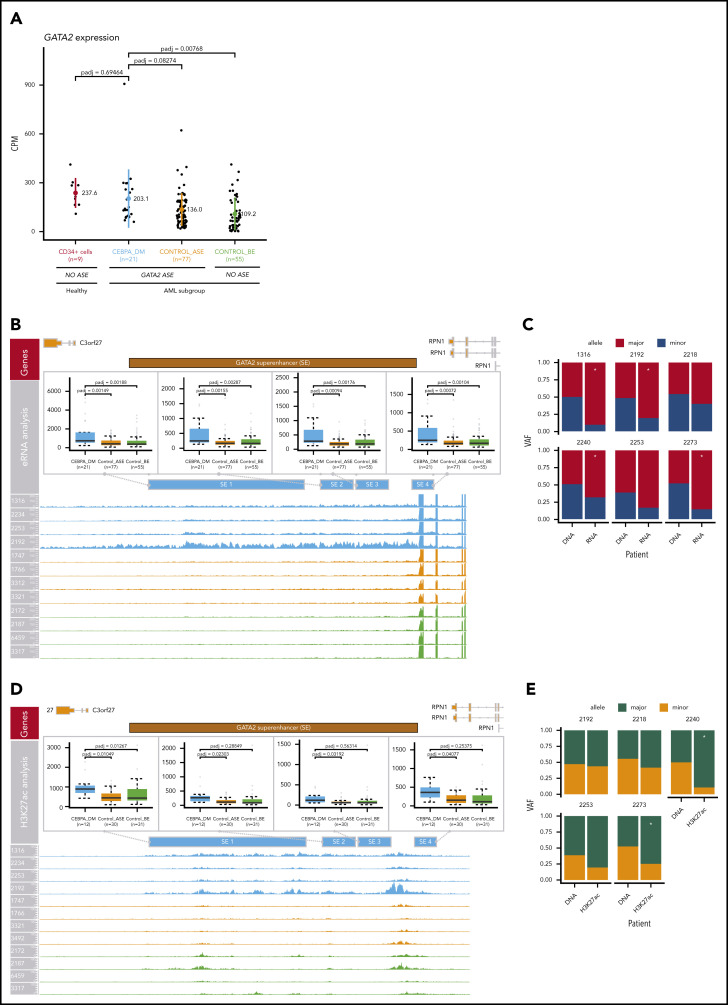
Figure 7.
Compensation of GATA2 levels by superenhancer activation. (A) Comparison of GATA2 expression levels in AML groups and CD34+ normal control cells (n = 9). The following AML groups were compared: CEBPA_DM (n = 21), Control_ASE (n = 77), and Control_BE (n = 55). No loss of GATA2 expression was observed in CEBPA DMs. (B) Analysis of enhancer RNA (eRNA) expression in the GATA2 −110-kb superenhancer. (C) ASE of eRNA in the GATA2 superenhancer, comparing CEBPA_DM (n = 21), Control_ASE (n = 77), and Control_BE (n = 55). The VAF of the DNA and the eRNA are shown. (D) Analysis of H3K27ac binding levels in the GATA2 −110-kb superenhancer, comparing CEBPA_DM (n = 12), Control_ASE (n = 30), and Control_BE (n = 31). (E) Allele specific binding of H3K27ac in the GATA2 super-enhancer. The VAF of the DNA and the H3K27ac reads are shown. *Indicates significance at a false discovery rate <0.05 in a χ2 test.

