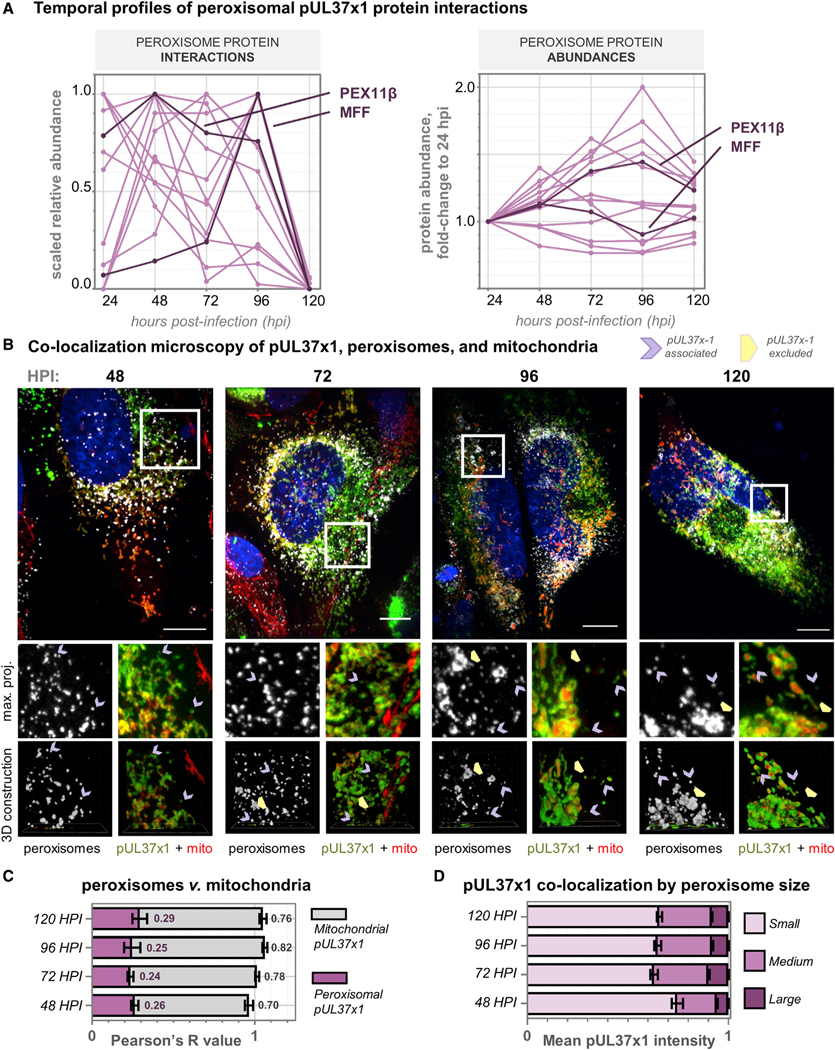
Figure 6. pUL37×1 Preferentially Localizes to Fragmented, Rather Than Enlarged, Peroxisomes during HCMV Infection.

(A) Left: relative abundances of pUL37×1 peroxisomal protein interactions, plotted across infection time. Right: protein levels of pUL37×1 peroxisomal interactors during infection, displayed as a fold change to the abundance at 24 hpi. In contrast to the changes in interaction levels, peroxisome proteins do not decrease in abundance at 120 hpi. PEX11β and MFF profiles are highlighted in darker color.
(B) Immunofluorescence images (z stack maximum projections) across HCMV infection, showing pUL37×1-GFP (green), mitochondria (red, MitoTracker), peroxisomes (white, PEX14 antibody), and DAPI (blue). Channels from a region of interest (white box) are shown below each merged image with a 3D reconstruction. Purple arrows indicate peroxisomes co-localized with pUL37×1 puncta, distinct from mitochondria. Yellow arrowheads indicate enlarged peroxisomes devoid of pUL37×1. Scale bars represent 10 μm.
(C) Colocalization quantification of data in (B) (n = 9 cells per time point), showing Pearson’s R values for pUL37×1 with peroxisomes (pink) or mitochondria (gray). Error bars denote SEM, and averages are indicated as text.
(D) pUL37×1 localization as a function of peroxisome size, measured from data in (B) (n > 6,000 peroxisomes per time point). Mean pUL37×1 intensity perperoxisome is plotted as a fraction of the total for each time point. Error bars denote SEM.
