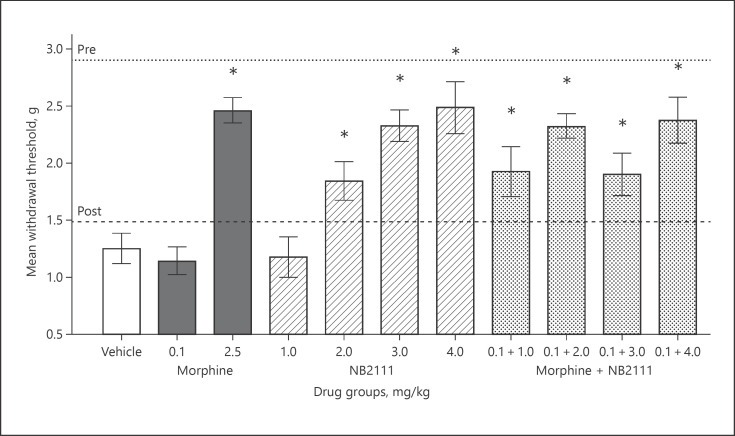
Fig. 2.
Mean paw withdrawal in grams of force (±SEM). Dotted and dashed lines depict baseline responses pre- and post-cisplatin administration protocol prior to drug efficacy screening. Vertical bars represent mean responses on the drug efficacy screening day for drug treatment conditions. Doses are in mg/kg and delivered IP 45 min prior to testing. * Denotes significant attenuation of tactile allodynia compared to the vehicle group (p < 0.05). Sample sizes were n = 9–11.

