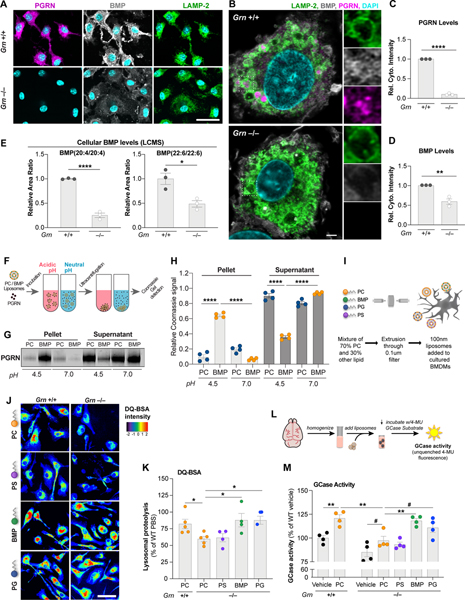
Figure 2. PGRN regulates lysosomal function via control of BMP levels.
(A) Epifluorescence microscopy analysis of PGRN, BMP, and LAMP-2 in BMDMs showing no PGRN signal and reduced BMP signal in Grn−/− cells. Scale bar: 50 μm. (B) Super-resolution microscopy analysis of markers in (A) highlighting lysosomal localization of PGRN and BMP in Grn+/+ cells. Scale bar: 2 μm. (C,D) Levels of PGRN (C) and BMP (D) from immunofluorescence in (A) showing PGRN loss and reduced BMP in Grn−/− BMDMs. (n=3 independent experiments; Student’s t-test). (E) LCMS analysis of BMP species in BMDMs showing a decrease in PUFA-BMP levels in Grn−/− cells. (n=3 independent experiments; Student’s t-test). (F) Cartoon of liposome sedimentation assay with recombinant huPGRN and PC vs. BMP liposomes after incubation at acidic or neutral pH. (G) Coomassie Blue stain of PGRN after sedimentation and SDS-PAGE. (H) PGRN levels in pellet (bound) and supernatant (free) fractions from (G). (n = 4 independent experiments; one-way ANOVA, Dunnett’s multiple comparison). (I) Cartoon of liposome supplementation paradigm for the DQ-BSA assay in BMDMs. (J) Fluorescence microscopy of lysosomal proteolysis using the DQ-BSA assay after artificial coloring of the fluorescence intensity. Scale bar: 50 μm. (K) Quantification of the DQ-BSA fluorescence from (J) showing rescue of lysosomal proteolysis in Grn−/− BMDMs treated with BMP and PG liposomes. (n = 5 independent experiments; one-way ANOVA, Dunnett’s multiple comparison). (L) Cartoon of liposome supplementation paradigm to assess GCase activity in brain homogenate. (M) Quantification of GCase activity in detergent-free 6–7 mo. brain extracts showing rescue of GCase activity in Grn−/− extracts treated with BMP and PG liposomes. (n = 4 mice, representative of 2 independent experiments; one-way ANOVA, Dunnett’s multiple comparison). #p<0.1, *p<0.05, **p<0.01, ****p<0.0001. Data shown as geometric mean±SEM. See also Fig. S2.

