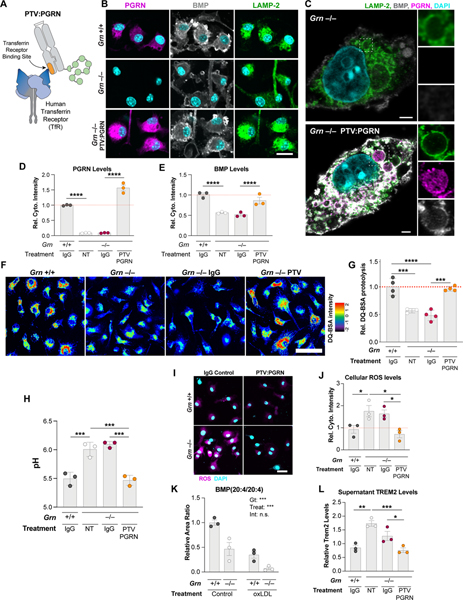
Figure 3. PTV:PGRN rescues lysosomal and inflammatory phenotypes in Grn−/− BMDMs.
(A) Architecture of PTV:PGRN fusion protein, showing the huTfR binding site in the Fc domain (orange) linked to huPGRN. (B-C) Epifluorescence (B) and super-resolution microscopy (C) representative images of PGRN, LAMP-2, and BMP in untreated Grn+/+ and Grn−/− BMDMs or Grn−/− BMDMs treated with 50nM PTV:PGRN for 72h. PTV:PGRN restores PGRN and BMP immunoreactivity in mutant cells. Scale bar: 25 μm (B), 2 μm (C). (D-E) Levels of PGRN (D) and BMP (E) from immunofluorescence in (B) showing rescue in Grn−/− BMDMs after treatment with PTV:PGRN, but not IgG control. (n = 3 independent experiments; one-way ANOVA, Dunnett’s multiple comparison). (F) Fluorescence microscopy of lysosomal proteolysis using the DQ-BSA assay. PTV:PGRN, but not IgG control, rescued the decrease in DQ-BSA fluorescence, and thus lysosomal proteolysis, in Grn−/− BMDMs. Artificial coloring of fluorescence intensity was used. Scale bar: 50 μm. (G) Quantification of the DQ-BSA fluorescence from (F) showing rescue of lysosomal proteolysis in the Grn−/− BMDMs with PTV:PGRN, but not IgG control. (n = 4 independent experiments; one-way ANOVA, Dunnett’s multiple comparison). (H) Lysosomal pH measurements showing rescue of alkalinized pH in the Grn−/− BMDMs treated with PTV:PGRN, but not IgG control. (n = 3 independent experiments; one-way ANOVA, Dunnett’s multiple comparison). (I) Fluorescence microscopy of reactive oxygen species (ROS) using the DCFDA assay. PTV:PGRN, but not IgG control, rescued the increase in DCFDA fluorescence, and thus ROS production, in Grn−/− BMDMs. Scale bar: 25 μm. (J) Quantification of the DCFDA fluorescence from (I) showing rescue of ROS levels in the Grn−/− BMDMs treated with PTV:PGRN, but not IgG control. (n = 3 independent experiments; one-way ANOVA, Dunnett’s multiple comparison). (K) Quantification of BMP (20:4/20:4) levels showing a decrease in both Grn+/+ and Grn−/− after treatment with oxLDL, but not vehicle control. (n = 3 independent experiments; two-way ANOVA, Tukey’s multiple comparison). (L) Quantification of soluble TREM2 levels in conditioned media from BMDM analyzed in (J) showing an increase in Grn−/− BMDMs and a rescue after PTV:PGRN treatment, but not control IgG. (n = 3 independent experiments; one-way ANOVA, Dunnett’s multiple comparison). *p<0.05, **p<0.01, ***p<0.001, ****p<0.0001. Data shown as geometric mean±SEM. See also Fig. S3.

