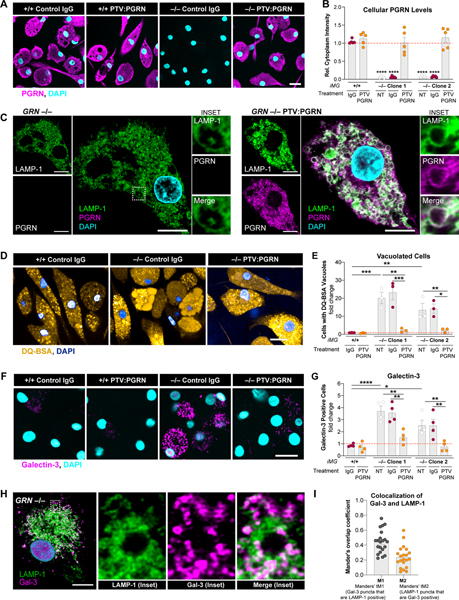
Figure 4. PTV:PGRN rescues endolysosomal vacuolization and endomembrane damage in human GRN−/− iMG.
(A) Epifluorescence microscopy of PGRN in GRN+/+ and GRN−/− human iPSC-derived microglia (iMG) treated with 100 nM control IgG or PTV:PGRN each day for 3 days. PTV:PGRN restores PGRN in mutant cells. Scale bar: 25 μm. (B) Quantification of PGRN levels in (A) showing rescue of the protein in two independent GRN−/− iMG clones after treatment with PTV:PGRN. NT, no treatment. (n = 3 independent experiments; one-way ANOVA, Dunnett’s multiple comparison). (C) Super-resolution microscopy of PGRN and LAMP-1 in GRN−/− iMG showing PTV:PGRN restores PGRN localization in the lysosomes and corrects the vacuolization phenotype. Insets: higher magnification of lysosomes with single channels and merge. Scale bar: 10 μm. (D) Fluorescence microscopy of DQ-BSA fluorescence in GRN+/+ and GRN−/− iMG showing PTV:PGRN rescues the vacuolization of GRN−/− iMG. Images show increase in fraction of cells containing one or more large vacuoles filled with the fluorescent dye GRN−/− iMG. Scale bar: 25 μm. (E) Quantification of % cells with DQ-BSA-filled vacuoles GRN+/+ and GRN−/− iMG with no treatment (NT) or after treatment with IgG control or PTV:PGRN. (n = 3 independent experiments; one-way ANOVA, Dunnett’s multiple comparison). (F) Epifluorescence microscopy of galectin-3 (Gal-3) in iMG showing an increase in endolysosomal membrane damage, as denoted by the increased Gal-3 fluorescence, in GRN−/− iMG and a rescue with PTV:PGRN. Scale bar: 25 μm. (G) Quantification of Gal-3 positive GRN+/+ and GRN−/− iMG with no treatment (NT) or after a treatment with IgG control or PTV:PGRN. (n = 4 independent experiments; one-way ANOVA, Dunnett’s multiple comparison). (H) Super-resolution microscopy of Gal-3 and LAMP-1 in GRN−/− iMG. Insets: higher magnification of lysosomes with single channels and merge. Scale bar: 10 μm. (I) Quantification of colocalization of Gal-3 and LAMP-1 from (H) using Mander’s overlap coefficients. *p<0.05, **p<0.01, ***p<0.001, ****p<0.0001. Data shown as geometric mean±SEM. See also Fig. S4.

