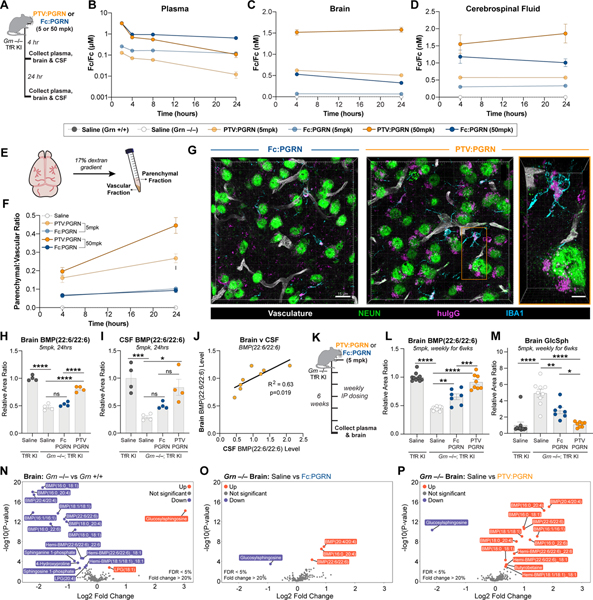
Figure 5: PTV:PGRN increases brain uptake and lysosomal lipid rescue in Grn−/−; TfRmu/hu mice relative to Fc:PGRN.
(A) Schematic of 24h biodistribution study in 3mo Grn−/−; TfRmu/hu mice. (B-D) Concentration of Fc domain in plasma (B), brain (C) and CSF (D) as determined by Fc sandwich ELISA (n=4/group, Two-way ANOVA with Sidak’s multiple comparison test). (B) PTV:PGRN (dark orange = 50 mg/kg, light orange = 5mg/kg) is cleared more rapidly from plasma than Fc:PGRN (dark blue = 50mg/kg, light blue = 5mg/kg) at both dose levels (50mg/kg: padj<0.0001, 5mg/kg: padj<0.0001). (C) Brain PTV:PGRN concentrations are higher at either dose than 50mg/kg Fc:PGRN (50mg/kg PTV:PGRN: padj<0.0001, 5mg/kg PTV:PGRN: padj<0.001). (D) CSF Fc concentrations are greater for PTV:PGRN than Fc:PGRN at 50mg/kg dose (50mg/kg: padj<0.01, 5mg/kg: padj=0.3946). (E) Capillary depletion allows for separation of parenchymal and vascular brain fractions. (F) The parenchymal:vascular ratio of drug levels is increased by PTV:PGRN at 5 and 50mg/kg doses (n=4/group, Two-way ANOVA with Sidak’s multiple comparison test, 50mg/kg: padj<0.0001, 5mg/kg: padj<0.0001). (G) Representative fluorescence image 3D projections of thalamic huIgG (magenta) distribution 24h after a 50mg/kg IV dose of Fc:PGRN (left) or PTV:PGRN (right). Neuronal (NEUN), microglial (IBA1) and vascular (podocalyxin/CD31) compartments also labeled (scale bar: 15 μm). Inset: single cells with intracellular huIgG uptake. Scale bar: 5μm. (H) Relative brain abundance of BMP(22:6/22:6) 24h after 5mg/kg dose. PTV:PGRN increases huIgG concentrations vs. Fc:PGRN (n=4/group; one way ANOVA, Dunnett’s multiple comparison). (I) CSF BMP (22:6/22:6) in Grn−/−; TfRmu/hu mice treated with PTV:PGRN vs. Fc:PGRN. Only PTV:PGRN significantly increases BMP levels (n=4/group; one way ANOVA, Dunnett’s multiple comparison). (J) Correlation of brain and CSF BMP(22:6/22:6) levels in PTV:PGRN-treated mice (n=8, linear regression). (K) Schematic of 6-week repeat dosing study in 7mo Grn−/−; TfRmu/hu mice. (L) Rescue of brain BMP(22:6/22:6) by Fc:PGRN and PTV:PGRN. (n=7–10/group; one way ANOVA, Dunnett’s multiple comparison). (M) Rescue of brain GlcSph by Fc:PGRN and PTV:PGRN. (n=7–10/group; Kruskal-Wallis with Dunn’s post-hoc multiple comparisons). (N-P) Volcano plots of lipid and metabolite changes in Grn−/− vs. Grn+/+ mice (N), Fc:PGRN-treated (O), and PTV:PGRN-treated Grn−/− mice (P). **p<0.01, ***p<0.001, ****p<0.0001. Data shown as mean±SEM. See also Fig. S5.

