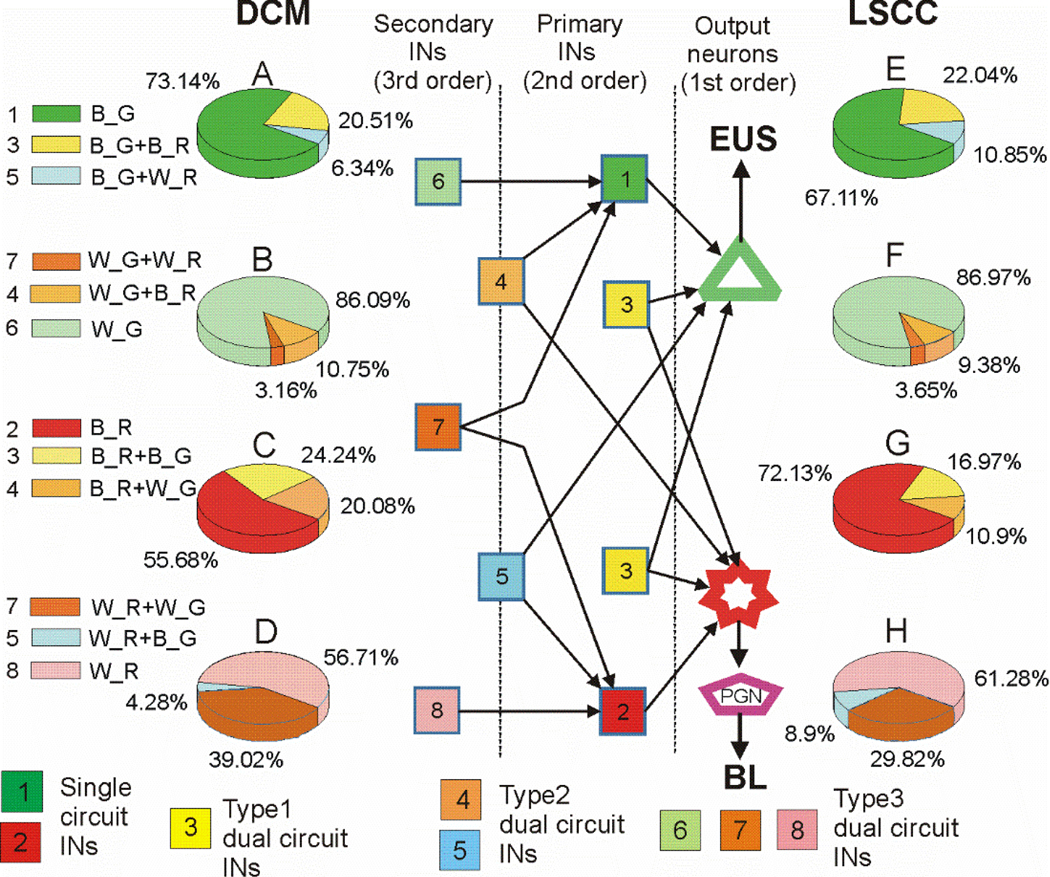
Fig.8.
Schematic of presumed organization of LUT-related interneurons and pie plots illustrating proportions of neurons of different orders. A, E– EUS-primary interneurons (pINs) presynaptic to EUS-MNs; B, F– EUS-secondary interneurons (sINs) presynaptic to EUS-pINs; C, G – BL-pINs, D, H – BL-sINs. Left column of pie plots show percentages of the specified classes in L6/S1 DCM, right column of pie plots shows percentages of the specified classes in L3/L4 LSCC. Color-coding in the diagram corresponds to color coding in the pie plots. Interneurons with dual staining are divided to 3 types according to combination of expressed markers. All bright yellow neurons are classified as “type1_INs”; cells expressing one bright marker and a weak or moderate other marker are classified as “type2_INs”; double-labeled INs weakly or moderately stained with either marker are classified as “type3_INs”. Therefore, type1_INs include only pINs, type3_INs include only sINs, whereas type2_INs include cells which are pINs in one circuit and sINs in the other circuit. Output neurons EUS-MNs and bPPGNs are depicted as a green triangle and a red star, respectively, were not counted. A peripheral ganglion is depicted as a purple pentagon. Combinations of capital letters near colored rectangles on the left stand for: bright (B) or weakly stained (W) neurons expressing either green (G) or red (R) fluorescent proteins. Brightly fluorescent cells are considered pINs and weakly fluorescent cells are sINs likely to be presynaptic to pINs.

