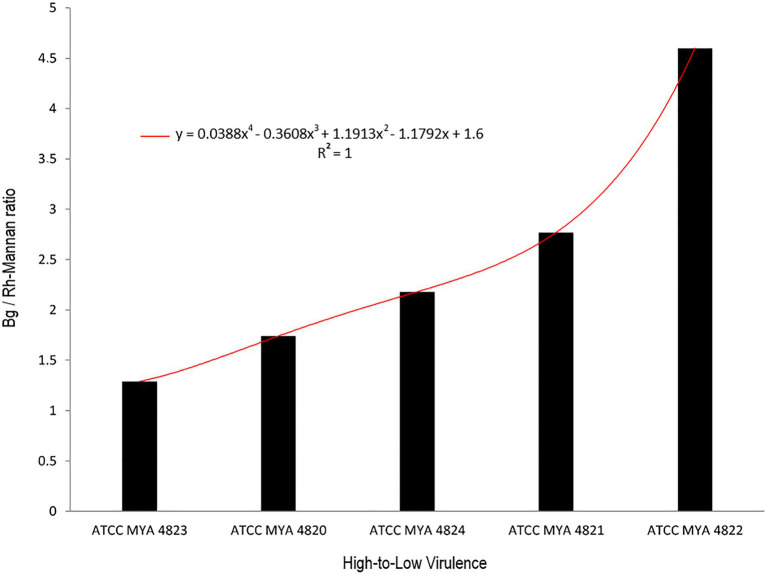
Figure 6.
Relation between β glucan vs. rhamnomannan ratio with strain virulence. Black columns represent the ratio of β glucan to rhamnomannan present in the cell wall. Strains are arranged from higher to the lower virulence reported. The red curve represents the polynomial curve of relationship, mathematically represented by an ascendant curve with an R2=1 with the polynomial function y=0.0388x4–0.3608x3+1.1913x2–1.1792x+1.6. Bg, β-glucan; Rh-Mannan, rhamnomannan.

