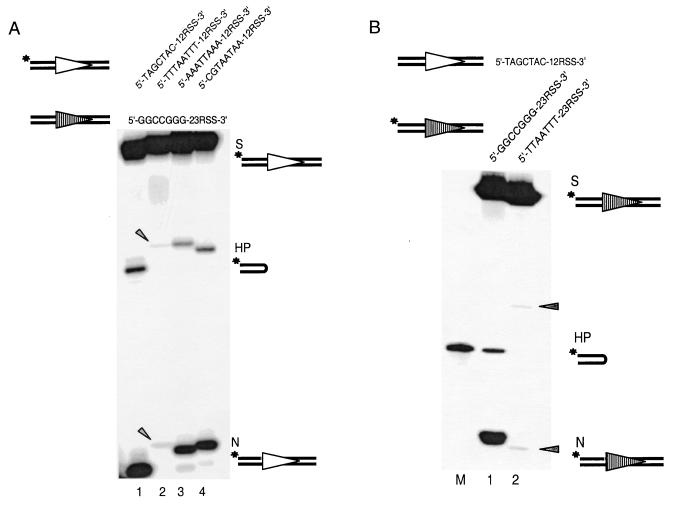
FIG. 2.
Coding end sequence effect seen in vivo can be reproduced in vitro. (A) Coding end sequence effects on the processing of 12-substrates. The 12-substrate is 5′ labeled for each individual reaction. As a result, only the nicked and hairpin products of the 12-substrate are detectable on the gel. The coding end sequence is varied here only on the 12-substrate, including high-efficiency (lane 1), low-efficiency (lane 2), and intermediate-efficiency (lanes 3 and 4) 12-substrates. The top strand sequences of the 12- and 23-substrates are indicated above the gel. Open and shaded triangles represent 12RSS and 23RSS, respectively. Asterisks indicate the radioactively labeled positions. The 12-high (lane 1) and 12-low (lane 2) have a 1-bp difference in length due to the different lengths of the coding end sequence. As a result, the nicking and hairpin products of the 12-high are one and two nucleotides shorter, respectively, than those of the 12-low. Oligonucleotide markers corresponding to each N and HP species are not shown but were run on each gel. S, substrate; HP, hairpin; N, nicking. The arrowheads indicate the positions of faintly visible nicked and hairpinned products for the 12-low substrate. (B) Coding end sequence variation on 23-substrates. M is a size marker corresponding to the hairpin product of 23-high (lane 1) because of its aberrant mobility on the denaturing gel. The mobility of the hairpin product of the 23-low (lane 2) is normal; therefore, no marker is shown for this hairpin product. All other symbols are as in Fig. 2A. The arrowheads indicate the positions of faintly visible nicked and hairpinned products for the 23-low substrate.

