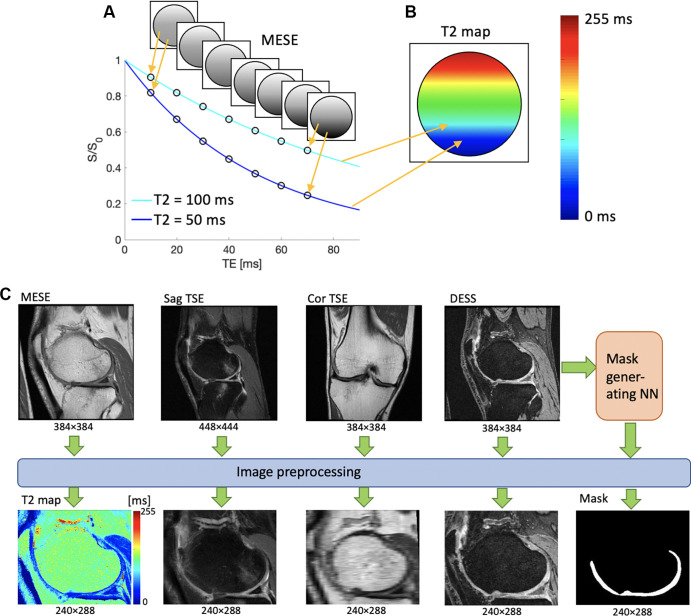
Figure 1:
(A, B) Schematic illustrations demonstrate the meaning of the pixel values of a T2 map. (A) Several signals are acquired with different echo times (TEs) by using a multiecho spin-echo (MESE) MRI sequence. When plotted as a function of TE, the intensities of each pixel form an exponential decay curve. The shorter the T2, the steeper the curve. (B) An exponential fit of the form S(t) = Soexp (−t/T2), where S(t) is the measured signal at time t, So is the signal before T2 decay, exp is the natural exponential function, and (−t/T2) is the negative ratio of the measurement time t and the T2 relaxation rate, is performed on the data points, resulting in a T2 value for each point, here drawn on a colored map. The color mapping of two sample points is shown for illustrative purposes. (C) Preprocessing workflow of image data. T2 maps are generated from exponential fitting of the time series MESE data, and the anatomic images are reformatted so that they all have the same spatial resolution, field of view, and image plane. Cor = coronal, DESS = double-echo in steady-state, NN = neural network, Sag = sagittal, S/So = signal with/before T2 decay, TSE = turbo spin echo.

