Figure 5:
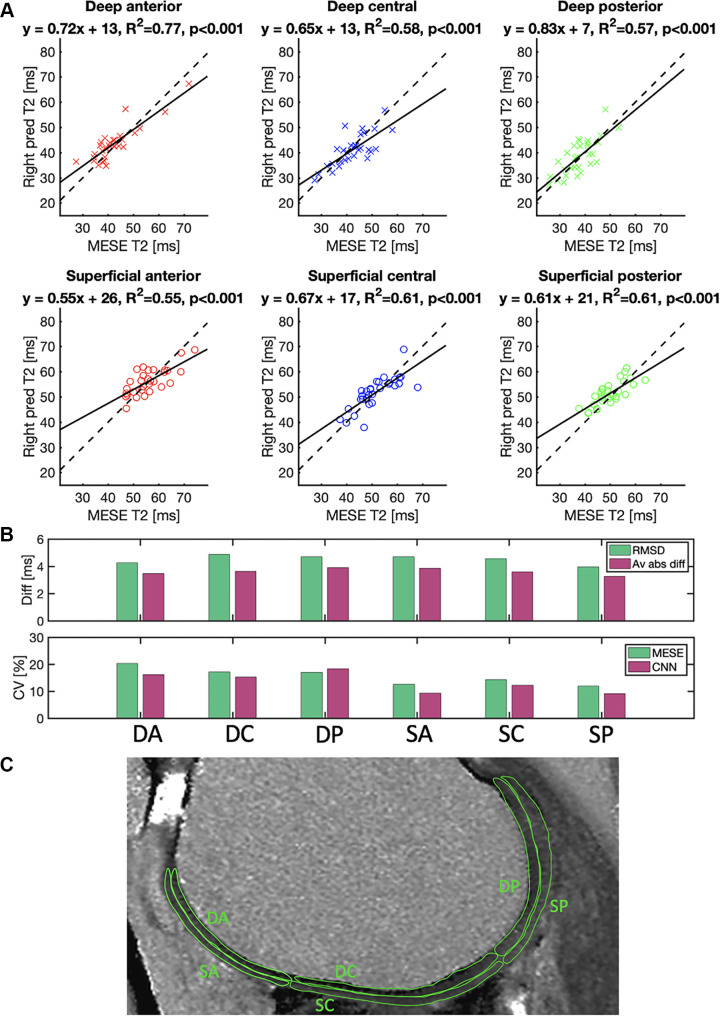
(A) Mean T2 in a region of interest drawn in the deep or superficial anterior (red), central (blue), or posterior (green) position on the femoral cartilage on images from 30 patients. Each point represents a value from a region of interest in a section of the right knee of one patient. The plots compare the reference multiecho spin-echo (MESE) T2 estimates of the right knee (x-axis) with the T2 predicted (pred) by the neural network (y-axis) of the same knee. Solid lines represent best-fit lines, and dashed lines represent y equal to x. (B) Root-mean-square differences (RMSD), average absolute differences (Av abs diff) (top), and coefficients of variation (CV) (bottom) in the cartilage regions. (C) Typical example of the different cartilage regions. CNN = convolutional neural network, DA = deep anterior, DC = deep central, diff = difference, DP = deep posterior, SA = superficial anterior, SC = superficial central, SP = superficial posterior.

