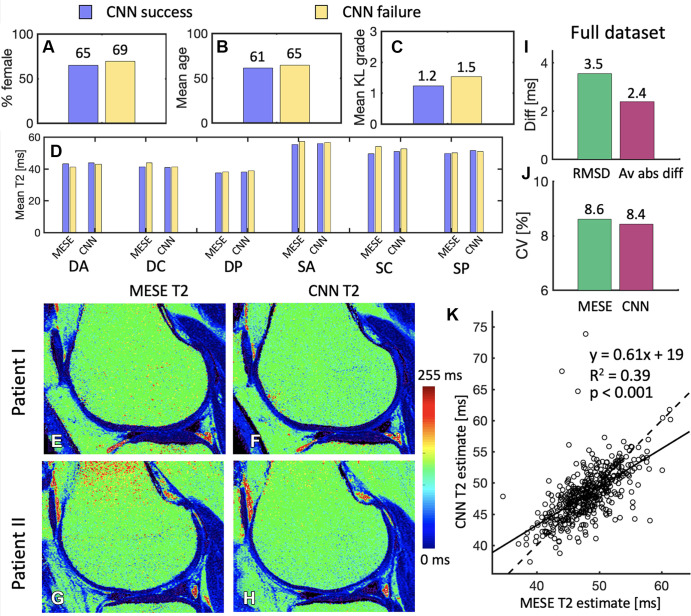
Figure 6:
(A–C) Comparison of the subsets of the randomly selected 30 patients evaluated by the radiologists, whereby the convolutional neural network (CNN) succeeded in convincing at least one radiologist (17 patients) that it was the multiecho spin-echo (MESE) map and where it did not (13 patients). In B, age is presented in years. (D) Comparison between the success and failure sets of multiecho spin-echo (MESE) T2 and CNN T2 in the six different cartilage subregions. (E, F) Sample (E) MESE T2 map and (F) CNN T2 map in a patient for which both readers failed to recognize which map was the CNN T2 map. (G, H) Sample (G) MESE T2 map and (H) CNN T2 map on which both readers accurately recognized which image was the CNN T2 map but one or both deemed the CNN T2 map to be better in terms of signal-to-noise ratio, sharpness, artifacts, and overall quality. (I) Root-mean-square difference (RMSD) and average absolute difference (Av abs diff) between the MESE T2 and CNN T2 maps. (J) Coefficients of variation (CV) for the MESE and CNN maps. (K) Comparison of average values from the MESE and CNN T2 maps. Plot shows the results for all 456 patients in the test dataset. One point represents one patient. The solid line represents the least-squares fit line through the points, while the dashed line represents the y equal to x line. DA = deep anterior, DC = deep central, diff = difference, DP = deep posterior, KL = Kellgren-Lawrence, SA = superficial anterior, SC = superficial central, SP = superficial posterior.

