. 2021 Jul 21;3(5):e200248. doi: 10.1148/ryai.2021200248

Figure 5:

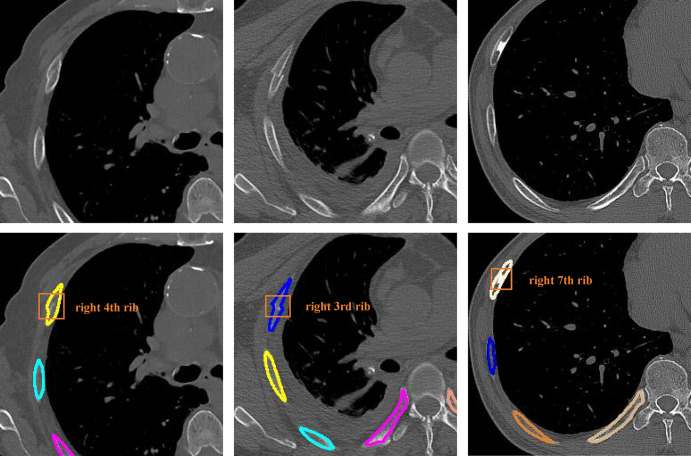
Detection and segmentation examples shown on CT images. The first row images are sections cropped from the raw CT images, and the second row images are the corresponding results from the deep learning model, with colored outlines indicating the different ribs. The first two columns successfully detected rib fractures, while the last column is a false-positive finding.

Detection and segmentation examples shown on CT images. The first row images are sections cropped from the raw CT images, and the second row images are the corresponding results from the deep learning model, with colored outlines indicating the different ribs. The first two columns successfully detected rib fractures, while the last column is a false-positive finding.