
Figure 2.
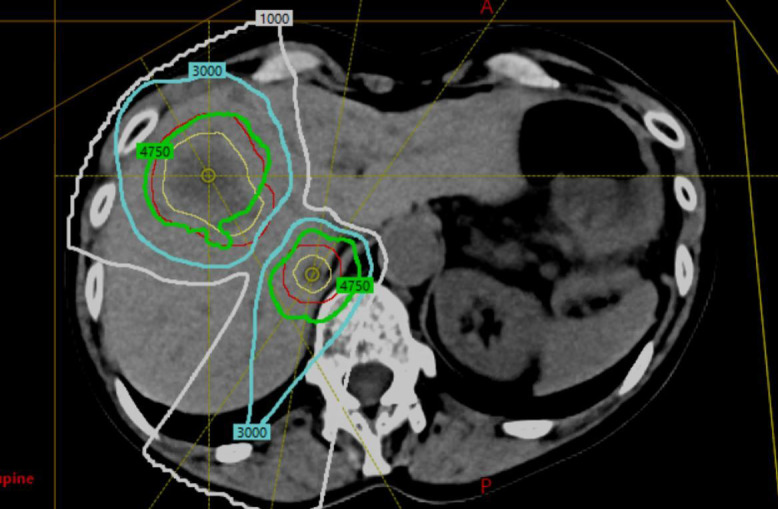
Treatment plan demonstrating 50 Gy in 5 fractions to each lesion and beam pathways (yellow = gross target volume anterior and posterior; red = planning target volume; green = 95% isodose line at 47.5 Gy; blue = 30 Gy isodose line; white = 10 Gy isodose line).