
Figure 3.
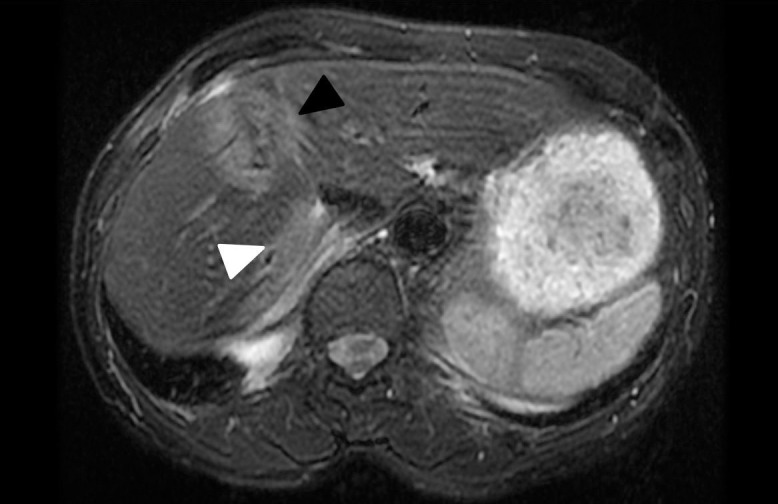
Liver magnetic resonance imaging (axial T2 FRFSE FS POST) at 1.5 years after therapy, which shows stable posttreatment changes at the original anterior tumor location (black arrow). In addition, the proton entry track of the posterior lesion is visible (white arrow). Note an area of normal-appearing liver tissue between the 2 regions with posttreatment changes.