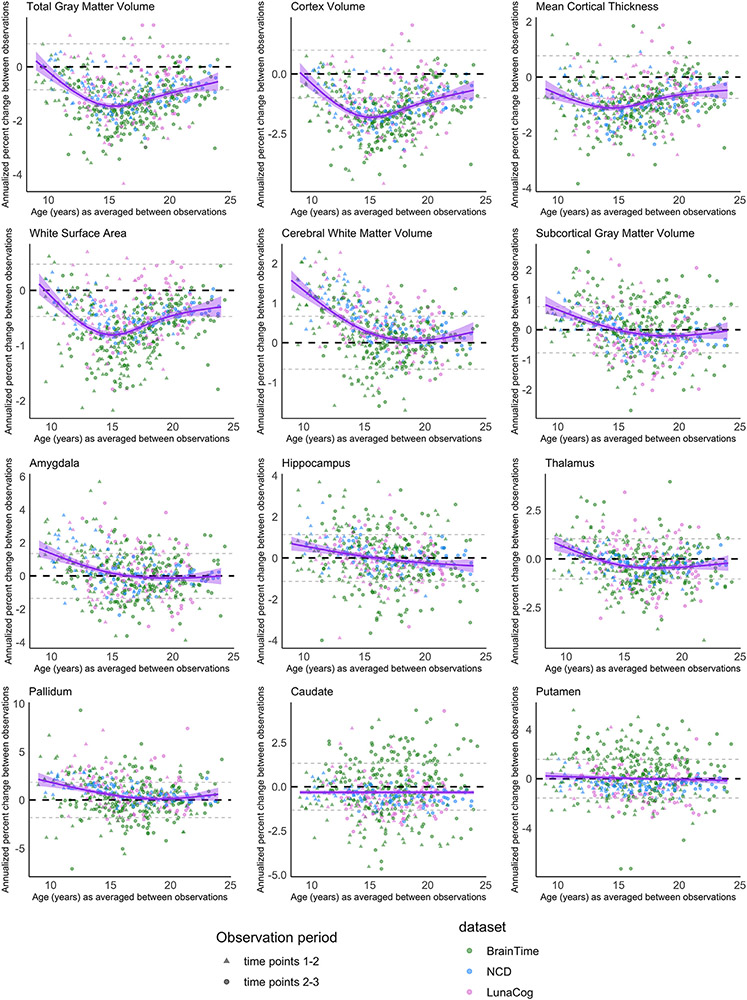
Fig. 2.
Annualized percent change over time for each individual (y-axis), against age at the midpoint of the observation period. The purple line reflects group-level annualized percent change seen with age. The black dashed line marks 0 on the y-axis and the dashed gray lines represent the standard deviation of annualized percent change across the whole sample. A) Total gray matter volume, cortex volume, cortical thickness, white surface area, and white matter volume B) Subcortical gray matter volume and specific subcortical structures. The equivalent graphs for annualized change can be seen in SFigure2.

