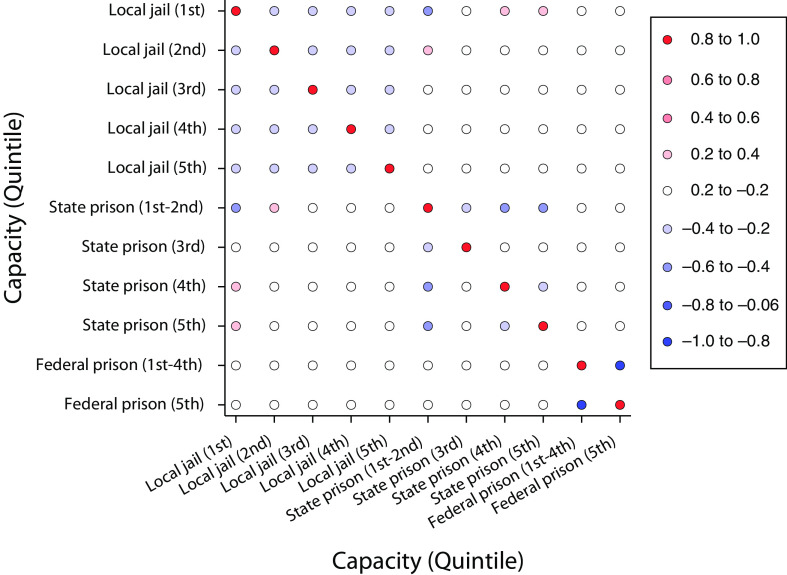
FIGURE 1—
Correlation Scatterplot of Number of Jails and State and Federal Prisons in a County, by Quintiles and Capacity: United States, 2020
Note. The color gradient represents the correlation coefficient. Presence of a state or federal prison is broken up by the total capacity of state or federal prisons within the county. For state prisons, we combine the first and second quintiles, which contain all counties with no prison capacity (54% of counties). For federal prisons, the first through fourth quintiles contain the counties with no prison capacity (93% of counties).

